Figures & data
Table 1. Descriptive statistics [Mean (Standard deviation)] for employment growth and sales growth of innovative and non-innovative firms, 2010–2012
Table 2. Definitions of variables used in the empirical model.
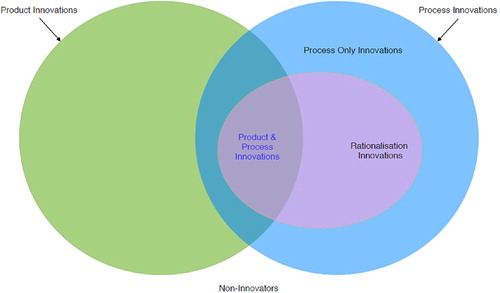
Figure 1. Venn Diagram: Different types of product & process innovators (Source: Authors’ own illustration).