Figures & data
Figure 1. Crop and livestock markets in the harvest season.
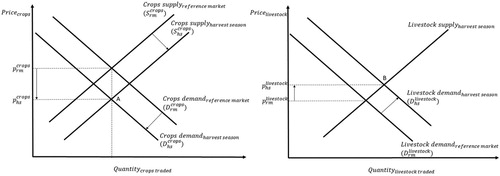
Figure 2. Crop and livestock markets in the lean season.
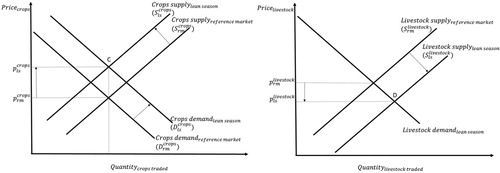
Table 1. Crop availability in % of moving 4-week intervals on 5 different markets in Mahafaly Plateau region and mean prices 2013–2014.
Figure 3. Harvest and lean season periods for different crops.
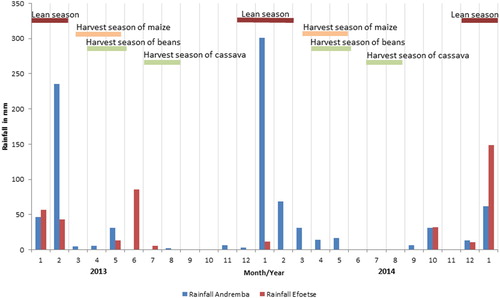
Table 2. Livestock availability in % of moving 4-week intervals on 5 different markets in Mahafaly Plateau region and mean prices 2013–2014.
Figure 4. Market relations of 79 villages in the Mahafaly Plateau region.
Notes: Dots show villages, squares markets. Lines indicate which market is visited by the inhabitants of the village. Size of squares depicts market importance.
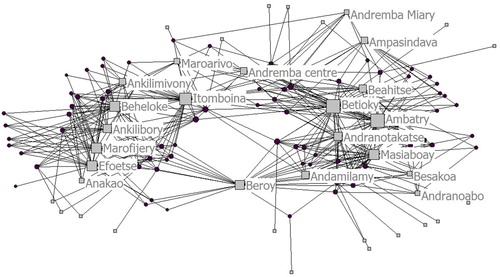
Table 3. Parameter estimates of the linear panel model with panel-corrected standard errors (PCSE) on the prices of 4 crops in the Mahafaly Plateau region in 2013 and 2014.
Figure 5. Price development for cowpea in 2013 and 2014 on five markets in the Mahafaly Plateau region, data organised in 4-week moving intervals.
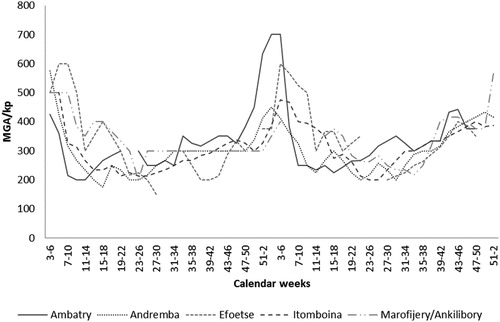
Table 4. Parameter estimates of the linear panel model with panel-corrected standard errors (PCSE) on the prices of 3 livestock animals in 4 markets in the Mahafaly Plateau region in 2013 and 2014.
Figure 6. Price development for female vibine goats (6 months to 1 year and 2 months old) in 2013 and 2014 on five markets in the Mahafaly Plateau region, data organised in 4-week moving intervals.
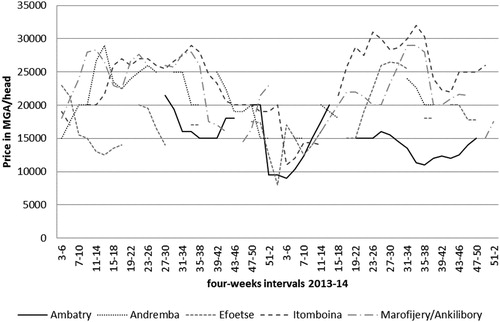
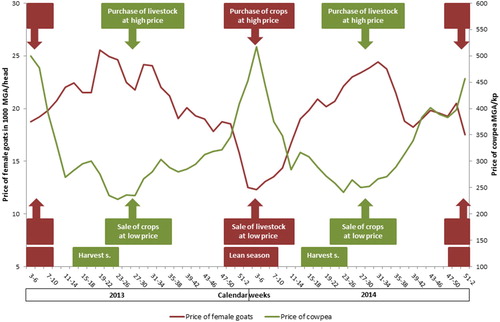
Figure 7. The double ‘sell low, buy high’ challenge: Farmers behaviour and market prices result in cyclical income losses for farmers.