Figures & data
Figure 1. Categorisation of heterogenous service industries.
Source: authors’ own.
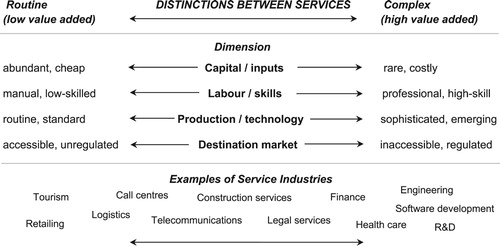
Figure 2. Services export growth, 1995–2012.
Source: OECD-WTO BaTIS database (Citation2018). Note: Trade flows are converted to constant prices using a US GDP deflator.
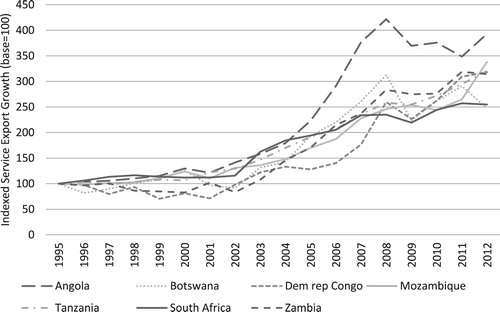
Table 1. Relative size and growth of services exports in SADC.
Figure 3. Detailed breakdown of the composition of services exports in SADC, 2012.
Source: OECD-WTO BaTIS database (Citation2018).
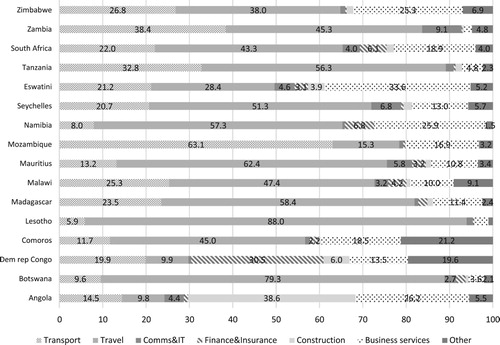
Figure 4. Overview of service imports and exports in SADC, 2012.
Source: OECD-WTO BaTIS database (Citation2018). Notes: The percentages reflect the weighted average across SADC countries.
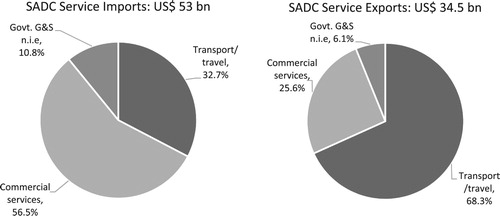
Figure 5. Total services trade in SADC ranked by GDP, 2012.
Source: OECD-WTO BaTIS database (Citation2018). Notes: GDP in 2012 sourced from World Bank (Citation2019).
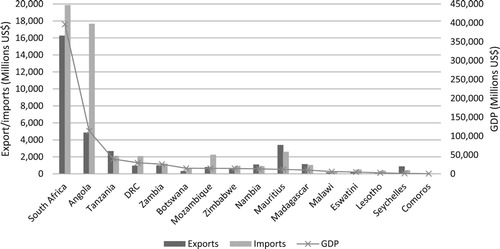
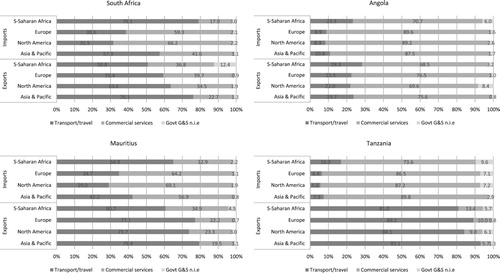
Figure 6. Total services exports and imports by major regions, 2012.
Source: OECD-WTO BaTIS database (Citation2018).
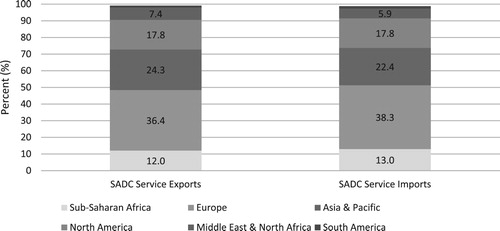
Figure 7. Composition of services exports by sector and region, largest SADC service exporters 2012.
Source: OECD-WTO BaTIS database (Citation2018).