
Figures & data
Figure 1. SADC share of world trade.
Notes: Regions are Common Market for Eastern and Southern Africa (COMESA), East African Community (EAC) and Southern African Development Community (SADC). South African exports to Botswana, Lesotho, Namibia and eSwatini are estimated for the 2000–2009 period using their average share in total South African exports over the 2010 and 2011 period. Shares are based on the aggregated value of trade for the region. Source: Author’s illustrations based on IMF DOTS, accessed January 2019.
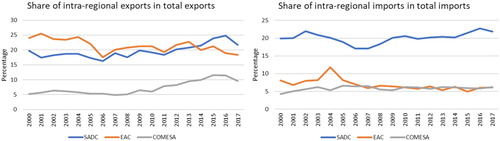
Table 1. Intra-Southern African exports as share of total exports.
Table 2. Intra-Southern African imports as share of total imports.
Figure 2. Composition of intra- and extra-SADC trade in goods 2015 (%).
Notes: Mirror data is used for Comoros, Lesotho & eSwatini. The SITC Revision 2 product 667 (Pearls, Precious and Semi-Prec. Stones) is included in Ores & Metals to reflect the commodity nature of this product. Share composition based on total value of SADC trade. Source: Author’s calculations using UNComtrade data.
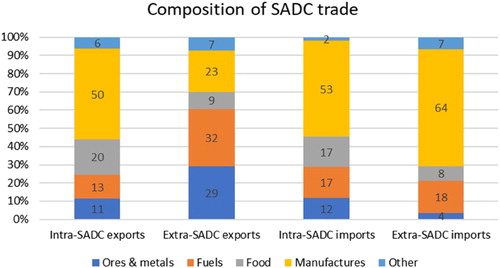
Figure 3. GVC participation decomposed into forward and backward integration 2015.
Note: Backward integration is calculated as the foreign value added share in gross exports. Forward integration is calculated as the domestic value added embodied in intermediate inputs used in other country exports as a share of gross exports. Values reflect the average across countries within each group. Source: Author’s calculations using the UNCTAD-Eora Global Value Chain Database.
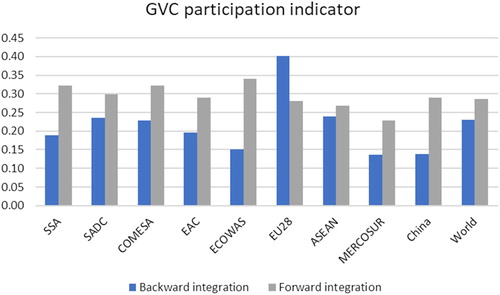
Figure 4. Backward integration into SADC and rest of world by SADC country, 2015.
Notes: SACU denotes Southern African Customs Union, RSADC denotes SADC excluding South Africa and ROW denotes rest of world. The data for Zimbabwe has been excluded as it shows unrealistic levels of integration, that are also apparent when looking at the disaggregated product data. Source: Author’s calculations using the UNCTAD-Eora Global Value Chain Database.
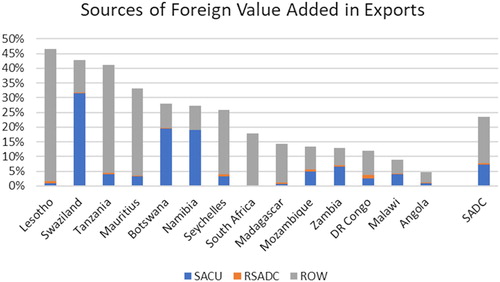
Table 3. Apparel exports from selected SSA countries to the US and EU (US$m).
Table 4. Apparel exports to South Africa (US$m).
Table 5. South African supermarkets in Africa; revenue and number of stores, 2015.