
Figures & data
Table 1. Demographic characteristics of study participants.
Table 2. Profile of vision impairment among participants, classified according to measured VA.
Figure 1. WTP variance between the two methodologies.
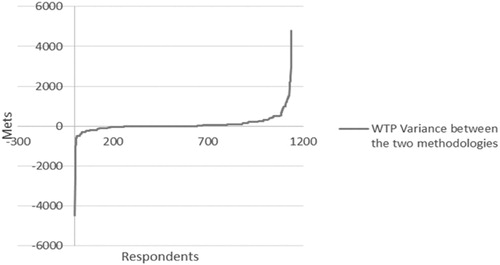
Table 3. Stated choice and final bid willingness to pay values according to demographic characteristics.
Table 4. Response variance from mean WTP values.
Table 5. Scope analysis to investigate if, when additional benefits were offered, WTP values increased (positive response) or not (negative response).
Figure 2. Association between starting bids and final bids.
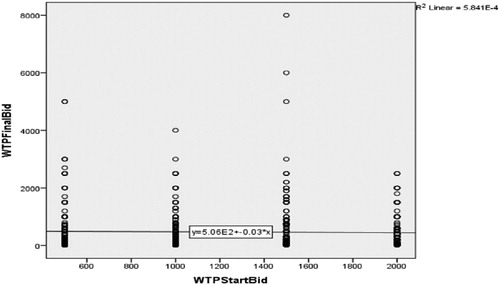
Table 6. Final bid WTP values according to starting bid.
Table 7. Multivariate analysis to assess relationships between WTP and several variables simultaneously.