
Figures & data
Table 1. The core grants.
Table 2. The means-test criteria for the core grants.
Figure 1. Baseline projection.
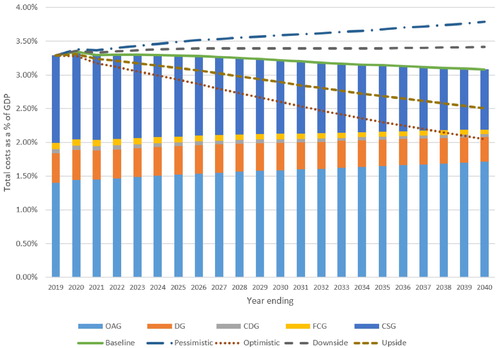
Table 3. Comparison of model and national treasury projections
Figure 2. Model backtest.
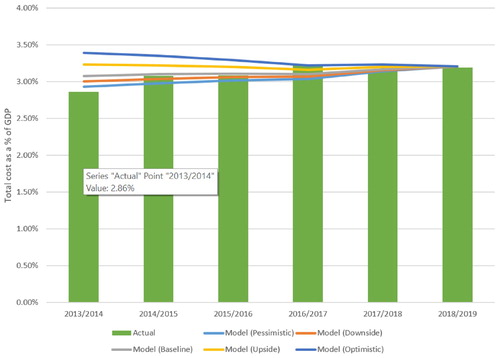
Figure 3. Sensitivity of cost to benefit increases.
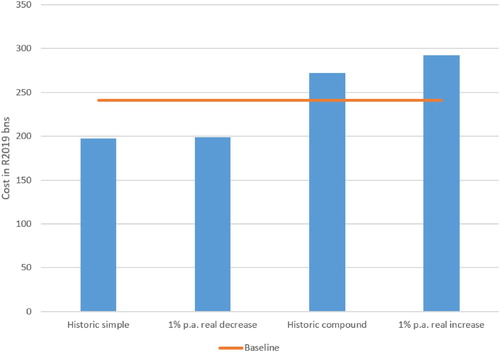
Figure 4. Sensitivity of cost to age-eligibility requirements.
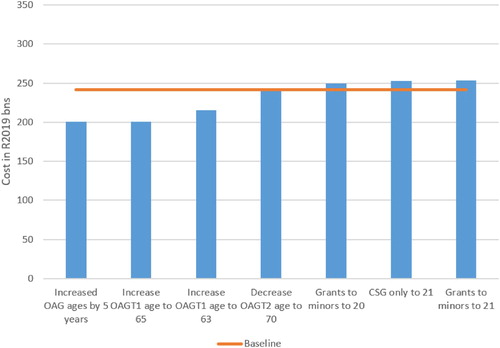
Table A1. Baseline parameters applied across all grants.
Table A2. Baseline Coverage and Percentage Paid Parameters