Figures & data
Figure 1. Dynamic livelihood strategies.
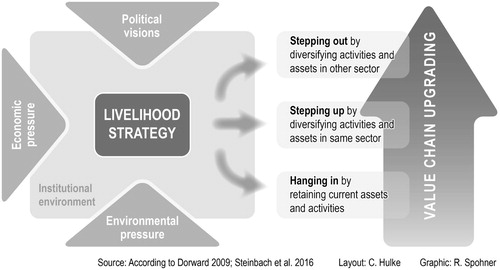
Table 1. Conducted interviews by category from September until November 2018.
Figure 2. Case study area: communal conservancies and non-conservancy areas in Zambezi region.
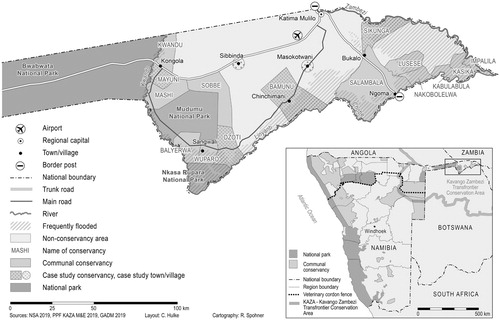
Table 2. Top-down visions of CBNRM, derived from FGDs and stakeholder interviews.
Table 3. Accumulated income of case study conservancies and income distribution in 2017. Own calculations, based on NACSO (Citation2017).
Table 4. Generalised effect mechanisms of small-scale agriculture, derived from FGDs, go-along interviews and stakeholder interviews.
Table 5. Expressions of bottom-up perceptions on possible livelihood strategies, derived from FGDs.
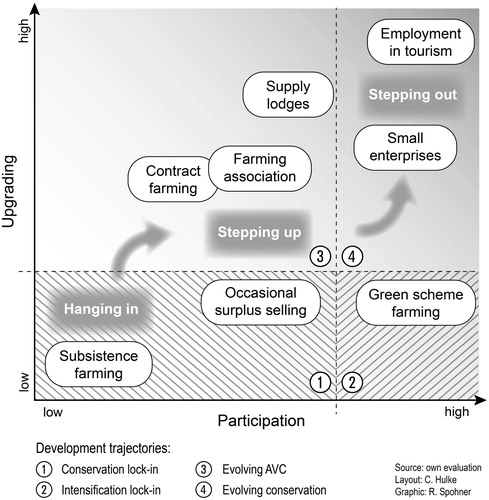
Figure 3. Examples of livelihood strategies in regard to participation and value chain integration.