Figures & data
Figure 1. Type of fuel used by education of household head and residence (%).
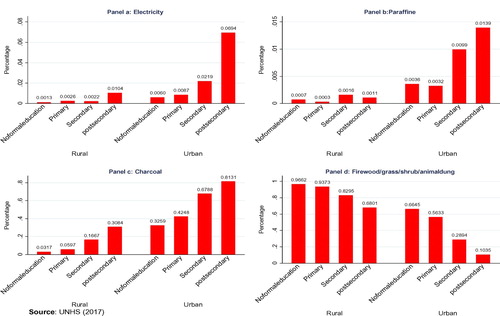
Figure 2. Type of fuel by wealth index of household head and residence (%).
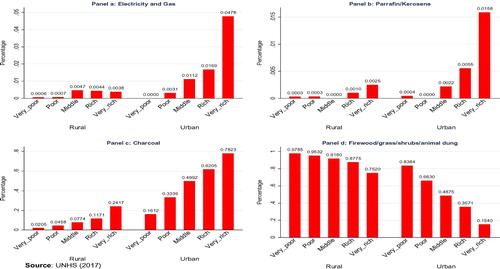
Figure 3. Type of fuel by tenure of residence of household (%).
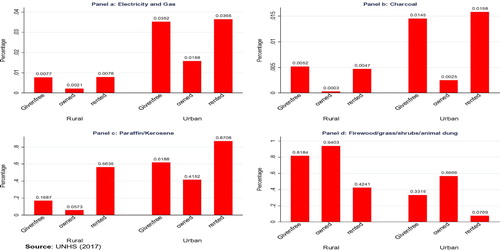
Table 1. Marginal effects for household sickness from HAP related sickness (cough and fever).
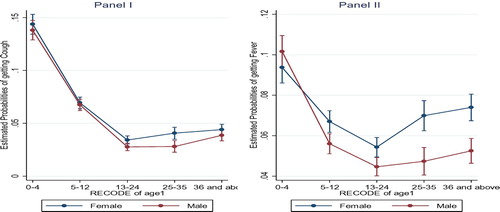
Figure 4. Estimated probabilities of contracting cough and fever by age group.