
Figures & data
Table 1. Summary statistics of analysis data.
Figure 1. Concentration Curves for out-of-pocket payment concentration and out-of-pocket payment as a share of the capacity-to-pay for the years 2005-06 and 2010. Note: Out-of-pocket payment share denominators are determined by different capacities to pay: adult equivalent total expenditure (AETE), adult equivalent nonfood expenditure (AENFE) and non-subsistence expenditure (NSE). Socioeconomic status is determined by household income per adult equivalent, and all data is weighted. (a) Concentration in 2005. (b) Concentration in 2010.
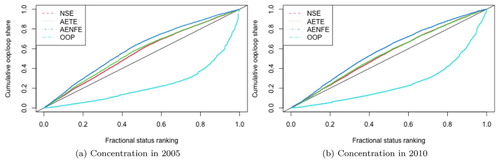
Table 2. Estimated concentration indexes and standard errors for out-of-pocket payments and shares relative to capacity-to-pay.
Table 3. Concentration index decomposition (2005), where socioeconomic status is based on adult equivalent household income.
Table 4. Concentration index decomposition (2010), where socioeconomic status is based on adult equivalent household income.
Table 5. Concentration index decomposition from 2005-06 to 2010, where socioeconomic status is based on a first principal component asset index.