Figures & data
Figure 1. The Laffer curve. Adopted from Agarwal (Citation2018).
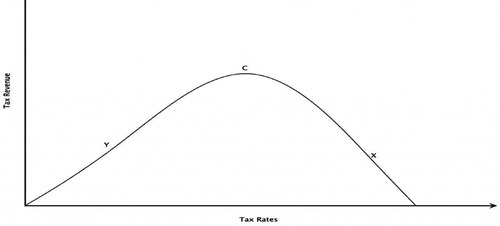
Table 1. Descriptive statistics.
Table 2. Pairwise correlation test results.
Table 3. Stationarity tests results.
Table 4. Regression output.
Figure 2. Normality test results.
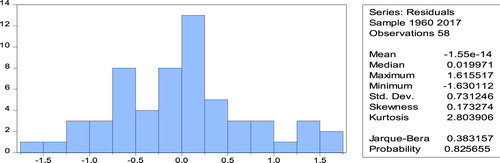
Table 5. Residual tests results.
Figure 3. OLS CUSUM stability test results.
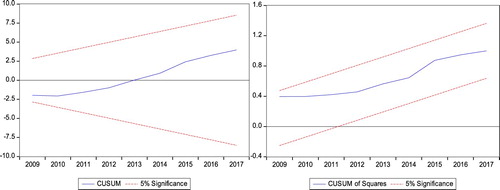
Table 6. Robustness tests results.
Table 7. Tax effort index results for South Africa.
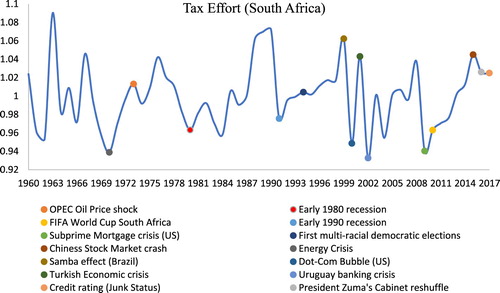
Figure 4. Trends in tax effort for South Africa. Source: Author’s computations.