Figures & data
Table 1. Estimated SSA vehicle sales (new vehicles and used imports), 2007–17.
Table 2. Automotive imports and exports, Nigeria, Kenya and Ghana, 2007–17 (US$ million).
Table 3. South African automotive exports to Africa (US$ million).
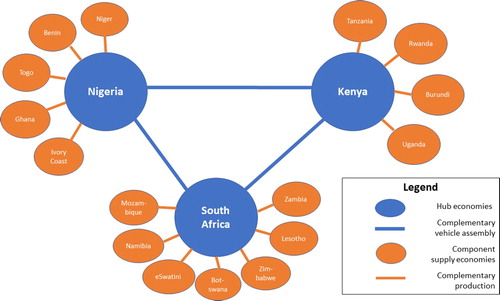
Figure 1. Hub and spoke model for SSA Automotive Pact development. Source: Barnes et al. (Citation2019).