
Figures & data
Figure 1. Johannesburg and Pretoria SMMEs concentration. Source: GCRO (Citation2015).
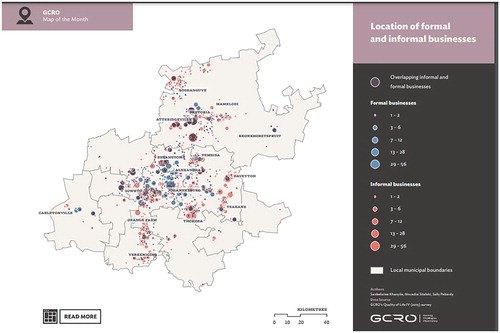
Table 1. High SMMEs concentrated zones.
Table 2. Distribution of economic activity in Gauteng Province.
Table 3. Demographic and descriptive statistics of respondents.
Table 4. Ordered logit regression output.
Table 5. Ramsey RESET test using powers of fitted values.
Table 6. Goodness of fit for multivariate.
Table 7. Wald tests for multivariate case.