
Figures & data
Figure 1. Conceptual framework for participation in urban agriculture (adapted from Gamhewage et al. Citation2015).
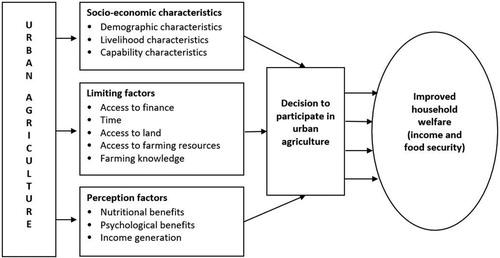
Table 1. Urban agriculture production levels.
Table 2. Household farming status by food security indicators.
Table 3. Levels of per capita income per day in US$ in the different informal settlement areas of the Cape Town Metropole.
Table 4. Likelihood of participating in urban agriculture (Probit Model).
Table 5. Average treatment effect on the treated (participating in urban agriculture) using nearest neighbours, stratification and radius matching methods.