Figures & data
Table 1. Investigation Variables.
Table 2. Frequency Distribution of Independent Variables Against the Household Food Insecure Access Prevalence (HFIAP) Scale.
Table 3. Odds Ratio Calculations of Independent Variables Against the HFIAP.
Table 4. Adjusted Odds Ratio (O.R.) Calculations Against the HFIAP using Binary Logistic Regression Analysis (n = 1754).
Figure 1. Bayesian Network of Conditionally Dependent Relationships Between Investigation Variables (n = 2,071).
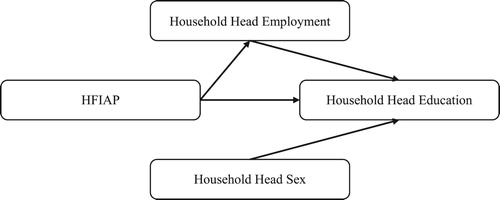
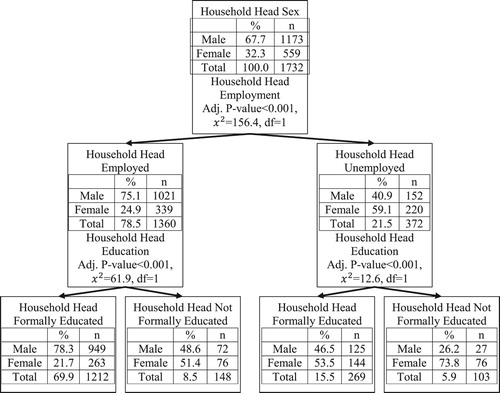
Figure 2. CHAID Decision Tree Categorizing Household Head Sex Using Employment and Education Status (n = 2,071).