
Figures & data
Table 1. Research questions and methods used.
Figure 1. Map of formal stores visited during fieldwork in Cape Town.
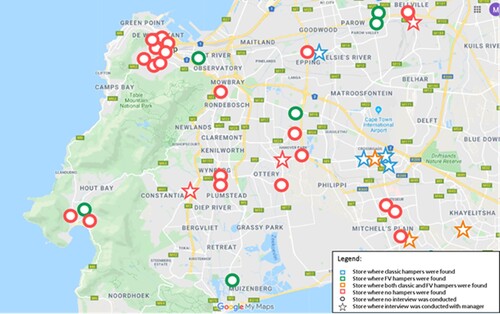
Table 2. Stores where interviews were conducted.
Figure 2. Pictures of a classic hamper in Philippi Superspar (Source: Author’s own).
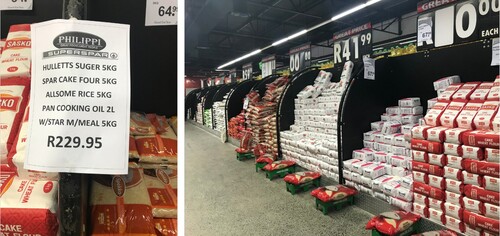
Figure 3. Spaza hampers (Source: Author’s own).
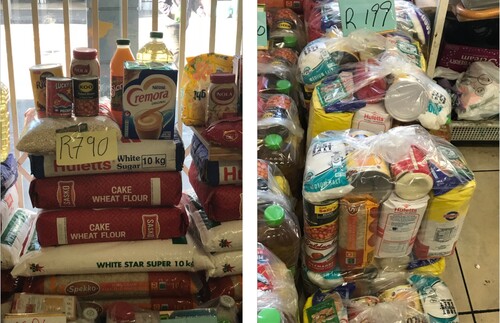
Figure 4. Pictures of FV hampers at Pick n Pay (Source: Author’s own).
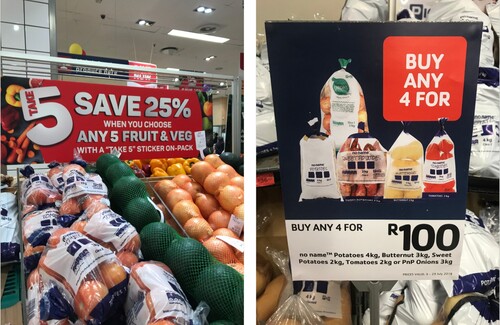
Table 3. Content and price of hampers found in Cape Town, and estimated savings.
Figure 5. Main products and brands comprising hampers, and the processing companies that produce them.
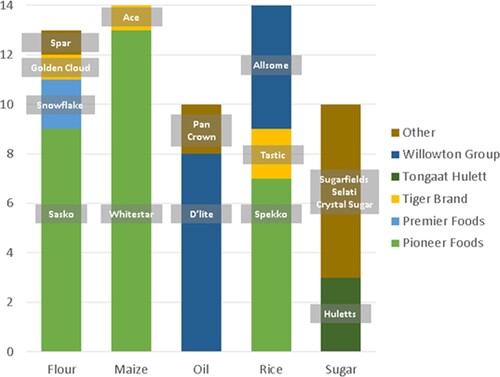
Table 4. Major South African grocery retail groups, according to market share (Trade Intelligence, Citation2016).
Figure 6. Hamper supply chain (made by authors, adapted from Greenberg, Citation2017).
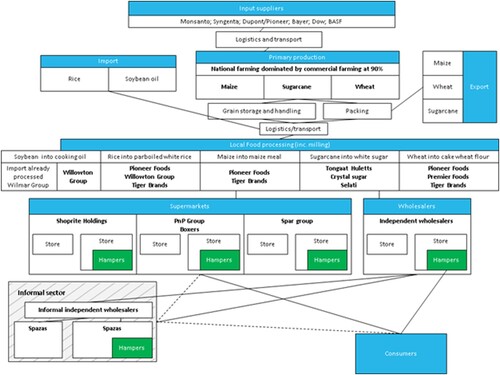
Table 5. Macro and micronutrient content of sample hamper observed during fieldwork, based on nutrition labels.