
Figures & data
Table 1. Potential livelihood impacts of GVCs.
Table 2. Potential livelihood impacts of RVC.
Figure 1. Location of study sites in relation to the layout of Namibia. Source: Authors, data from Namibia Statistics Agency.
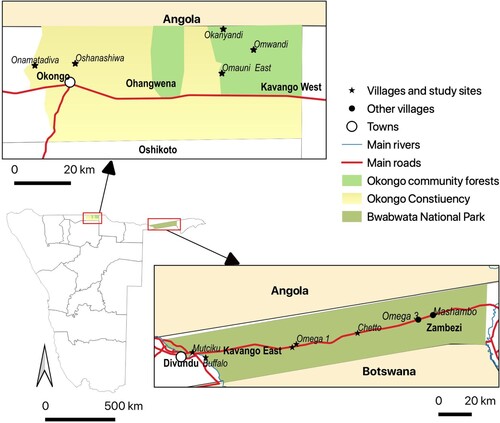
Figure 2. Price per kilogramme for Devil’s Claw harvesters over different years. Source: Authors, data from the KA Office in Mutciku.
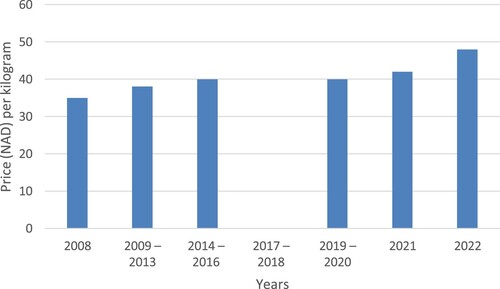
Table 3. NTFPs harvested in Okongo and BNP by the Khwe and !Xun for local or regional trade.
Table 4. NTFPs’ livelihood impacts on the Khwe and !Xun San in BNP and Okongo.