
Figures & data
Figure 1. Modified human capital theory framework considering the COVID-19 pandemic. Source: Adapted from Yu & Roos (Citation2018).
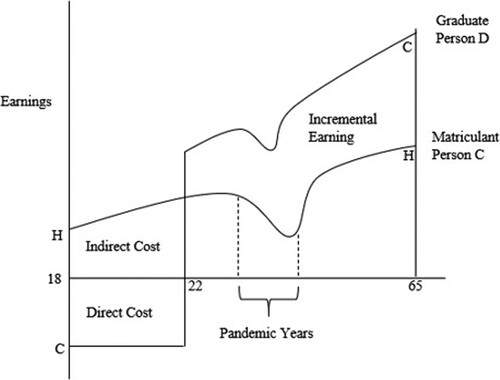
Figure 2. Labour force participation rates and unemployment rates, 1995–2022. Source: Authors’ own calculations using the 1995–1999 OHS, 2000–07 LFS September and 2008–22 QLFS data.
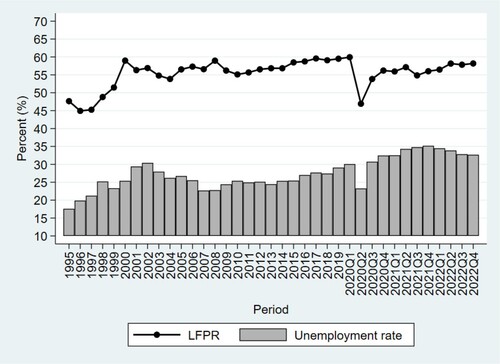
Figure 3. Number of employed and unemployed (millions), 1995–2022. Source: Authors’ own calculations using the 1995–1999 OHS, 2000–07 LFS September and 2008–2022 QLFS data.
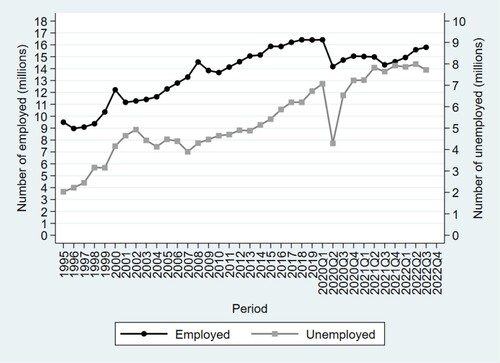
Table 1. Absolute and relative changes in labour force by personal characteristics.
Table 2. Absolute and relative changes in employed by personal characteristics.
Table 3. Absolute and relative changes in employment by occupation and industry.
Table 4. Absolute and relative changes in unemployed by personal characteristics.
Table 5. Profile of the people who were still employed in February 2020.
Table 6. Labour market status of NIDS-CRAM participants who were employed in 2020 February.
Table 7. Changes in labour market status (if any) of NIDS-CRAM participants who were employed in 2020 February.
Table 8. Number of times employed by number of times in the labour force.
Table 9. Labour market status transition between waves 1 and 5 of NIDS-CRAM participants who were employed in 2020 February.
Table 10. Weekly work days and daily work hours of employed in each NIDS-CRAM wave.
Figure 4. Primary reason of unemployed (who still worked in February 2020) not working in the past four weeks at the time of each NIDS-CRAM wave. Source: Authors’ own calculations using the NIDS-CRAM waves 1–5 data.
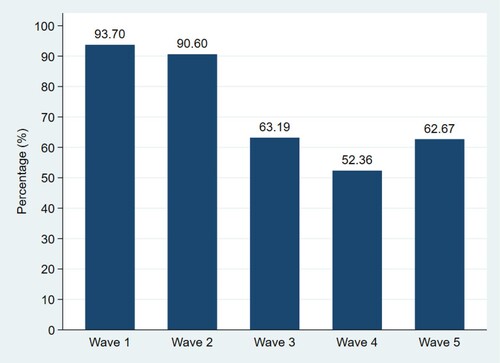
Table A1. Absolute and relative changes in the inactive by personal characteristics.
Table A2. Heckprobit regressions on employment likelihood, conditional on labour force participation.