Figures & data
Figure 1. Conceptual model of the study.
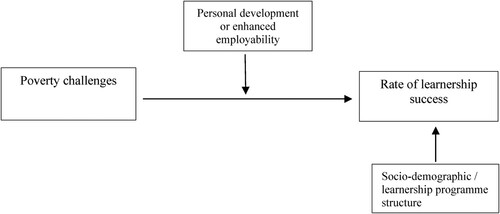
Table 1. Profile of the respondents.
Table 2. Descriptive statistics of learning outcomes and rate of success.
Table 3. Test of homogeneity (ANOVA) of the registered SETA.
Table 4. Descriptive statistics on poverty challenges.
Table 5. Regression analysis models on effect of poverty challenges on the rate of learnership success.
Table 6. Conditional effects of the focal predictor at values of the moderator.
Figure 2. Visualising the conditional effect of personal development.
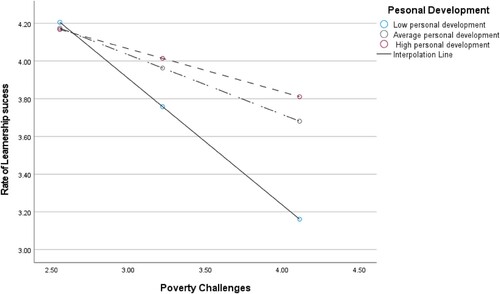
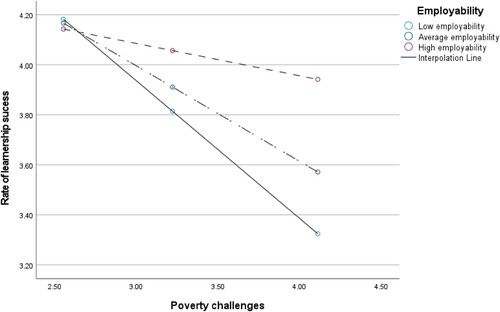
Figure 3. Visualising the conditional effect of enhanced employment.