Figures & data
Figure 1: The FPN structure
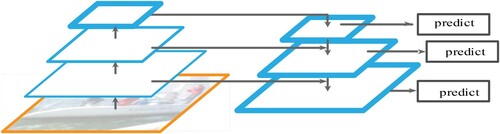
Figure 2: An example showing the comparison between ordinary convolution and dilated convolution
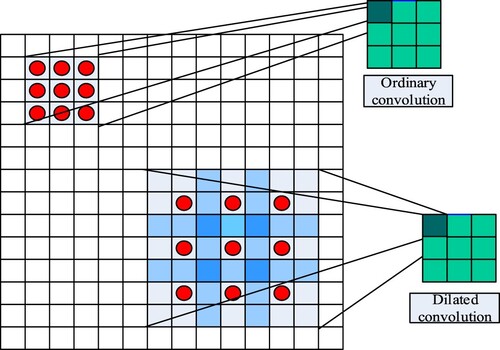
Figure 3: Structure diagram of FPN-D
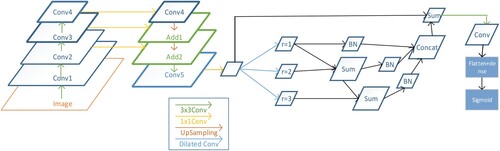
Figure 4: Schematic for the details of the addition process

Figure 5: Driver image before (left) and after (right) cropping
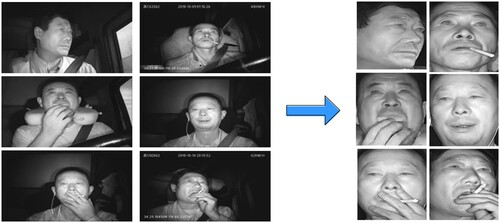
Table 1: Detailed structure of the network
Table 2: Confusion matrix
Figure 6: Plot showing the accuracy rate obtained by applying different network structure training to the dataset
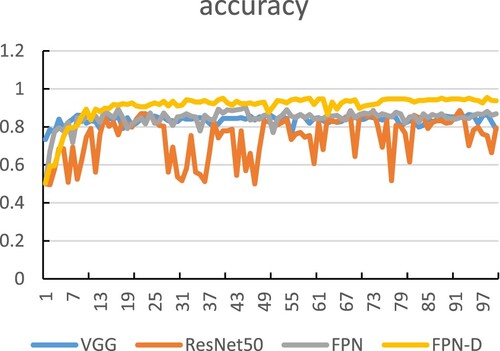
Figure 7: Plot showing the loss value for the validation set for the different network structure training
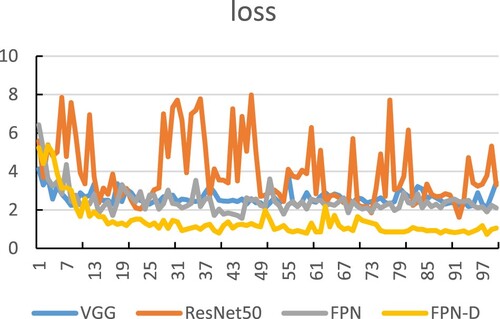
Figure 8: ROC curves for different methods
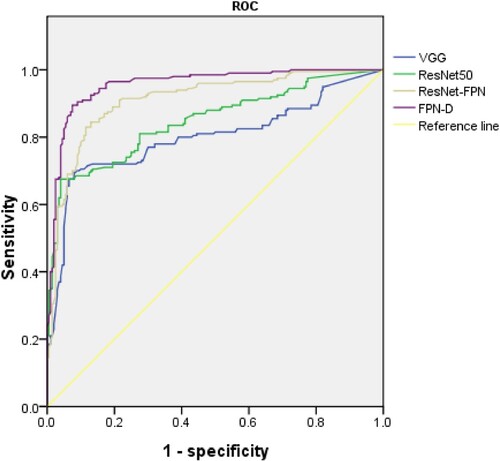
Table 3: Values of the performance of different methods
Table 4: AUC and CI values for the different methods
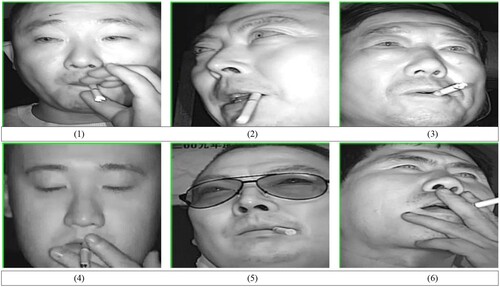
Figure 9: Test images of drivers smoking