Figures & data
Figure 1. Overview of the study area in southern Norway. Focus area at NE Snøhetta, Dovrefjell, is marked in red. Note the nearby climate station and boreholes at Snøheim.
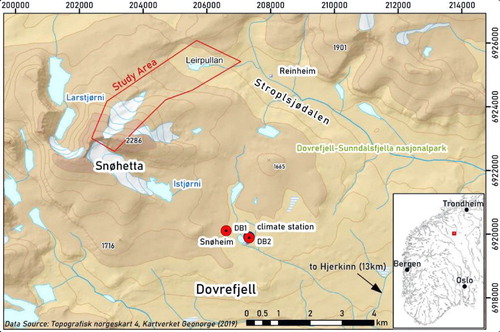
Figure 2. Location of water samples. Location of the sinkhole feature ‘Barrel Hole’ and the perennial lake ‘Milky Pond’ as indicated. Background image provided by Kartverket Geovekst og kommuner - Geodata AS (Citation2016).
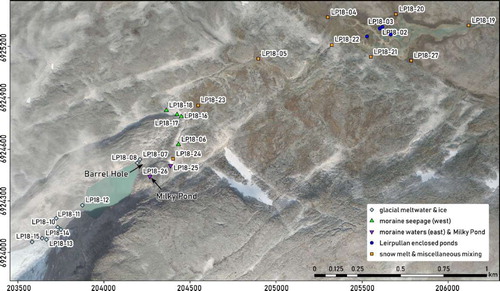
Figure 3. Map of the glacial and periglacial landforms and processes at NE Snøhetta, Dovrefjell, Norway.
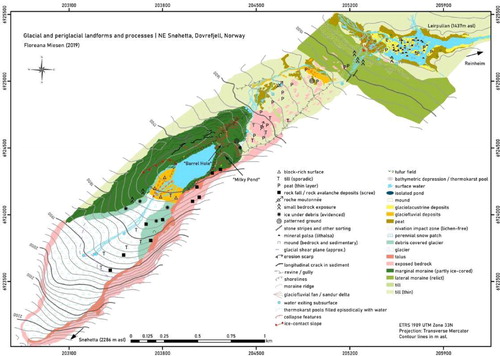
Figure 4. Surface analysis of the study area. (A) Surface curvature, (B) Terrain curvature, (C) Terrain aspect. Calculated from ArcticDEM (Porter et al. Citation2018).
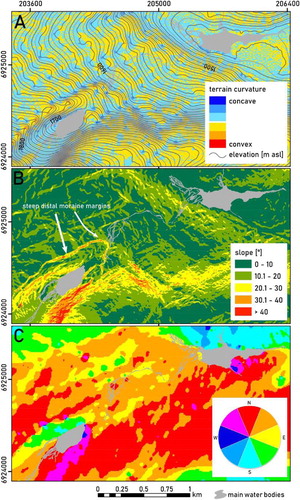
Figure 5. Lake surface area variability during melt season of 2018. Pixel colour shows count of PlanetScope scenes where semi-automated NDWI-calculation resulted in a classification as surface water. Note artefacts along SW shore are most likely produced by strong shading in satellite images. Based on data from planet.com.
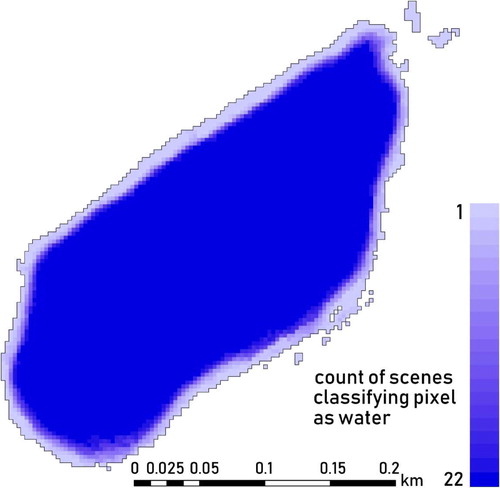
Figure 6. Melt season dynamics in 2013 (I), 2017 (II) and 2018 (II). (A) Lake surface area detected by NDWI from RapidEye (I) and PlanetScope (II, III) imagery and surface displacement near Barrel Hole according to InSAR (II, III), (B) positive degree days and (C) ground thermal profile at DB1 (I), DB2 (II, III). Based on data from planet.com, insar.ngu.no, eklima.met.no and GTN-P.
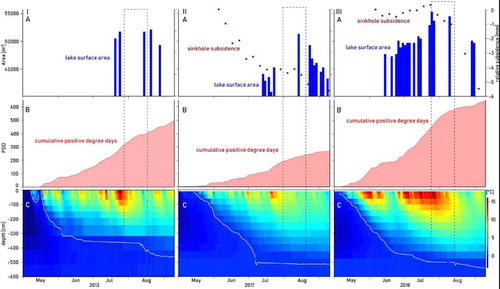
Figure 7. Sketch of the marginal moraine topography.
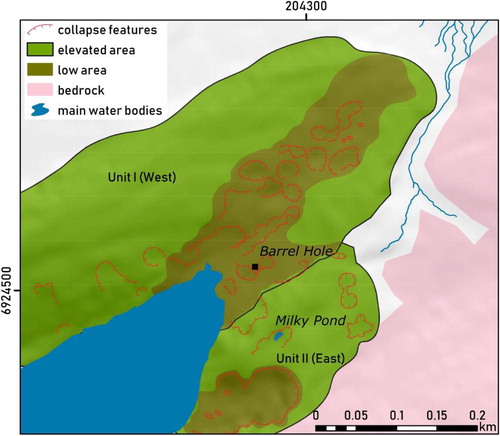
Figure 8. InSAR analysis of vertical surface movement at the marginal moraine. Left: Spatial distribution of mean vertical ground movement (mm/a). Note that colour scale applies to range between −5 and 5 mm/a, while some datapoints lie outside this range. Right: Deviation from mean vertical ground movement averaged for the frontal part of the marginal moraine (as indicated by orange dashed polygon on map). Linear regression indicated by orange dashed line. Sentinel 1-based InSAR data processing by Norges Geologiske Undersøkelse (Citation2018). Background image of map provided by Kartverket Geovekst og kommuner - Geodata AS (Citation2016).
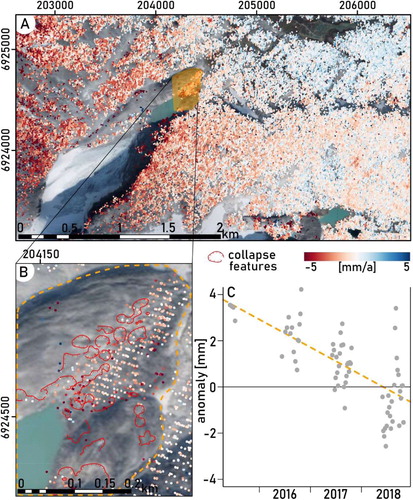
Figure 9. Correlation of δ18O and δD along the GMWD. Note outliers marked in dark blue (LP18-01, LP18-03, LP18-28) corresponding to samples from enclosed ponds at Leirpullan; ice from debris-covered glacier (LP18-15) marked in light blue; water from Milky Pond (LP18-26) on eastern part of moraine marked in purple.
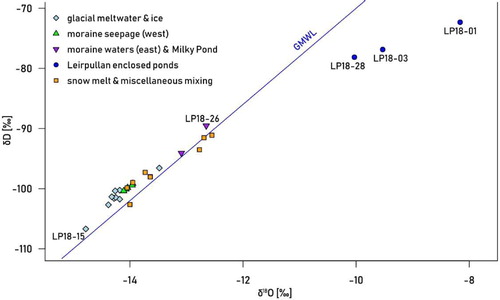
Figure 10. Density distribution of process domains by elevation as derived from a classification of mapped geomorphic landforms.
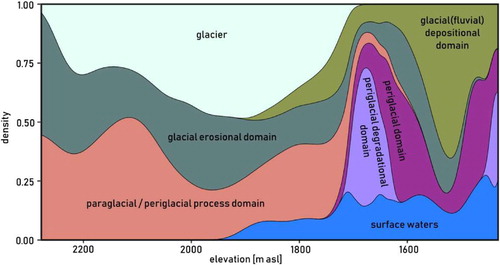
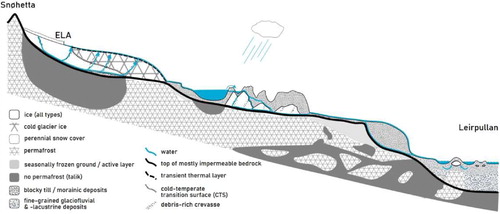
Figure 11. Conceptual model of the permafrost and ice distribution and the main meltwater routes in the study area. Only the western segment of the ice-cored moraine is displayed. Temperate glacier ice and the proglacial lake are underlain by taliks. Subsurface routeing in the ice-cored moraine takes place at the interface of the permeable substrate and the impermeable ice-core. Overflow of the proglacial lake may occur at sufficiently high lake levels. The relict moraine surrounding Leirpullan features both surface and subsurface routeing.