
Figures & data
Table 1. Descriptive statistics population age 20–64, in Stockholm County (Total), High-concentration neighbourhoods (High n’hoods) and moderate-concentration neighbourhoods (Moderate n’hoods) 1991 and 1999.
Table 2. Share (%) of the population staying in the same dwelling in Stockholm County and in high-concentration neighbourhoods (population, age 20–64), 1991 and 1999 cohorts.
Figure 1. Share of stayers in the 1991 population cohort, aged 20–64, rental and co-op tenures, high-concentration neighbourhoods. Source: PLACE database, author’s calculation.
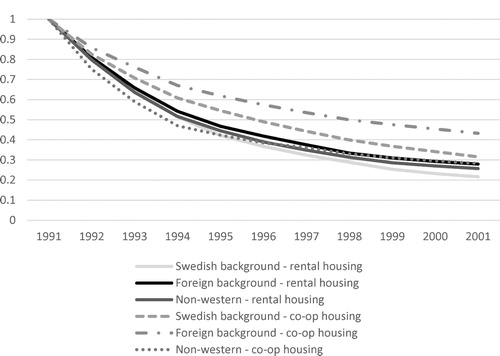
Figure 2. Share of stayers in the 1999 population cohort, aged 20–64, rental and co-op tenures, high-concentration neighbourhoods. Source: PLACE database, author’s calculation.
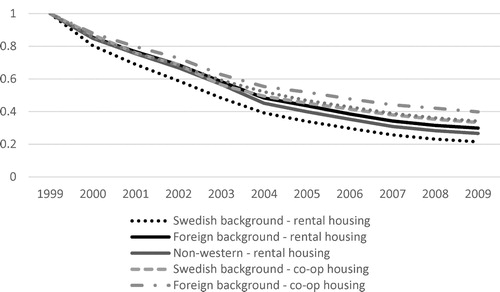
Table 3. Cox proportional hazard model estimating risk of moving. Total population in Stockholm, age 20-64.
Table 4. Logisitc regression models displaying the odds of a mover staying in high concentration neighbourhoods (0) after a move or leaving high concentration neighbourhoods (1). Intra-Stockholm movers only, selected results.
Table 5. Logisitc regression models displaying the odds of a mover staying in moderate concentration neighbourhoods or higher concentration neighbourhoods (0) after a move or leaving for a neighbourhood with fewer non-western foreign-born (1). Intra-Stockholm movers only, selected results.