
Figures & data
Table 1. Descriptive statistics for the main variables used in the empirical analysis of RDI patterns across region types and firm categories.
Figure 1. Share of firms receiving funding and overall RDI volume by region type and size class.
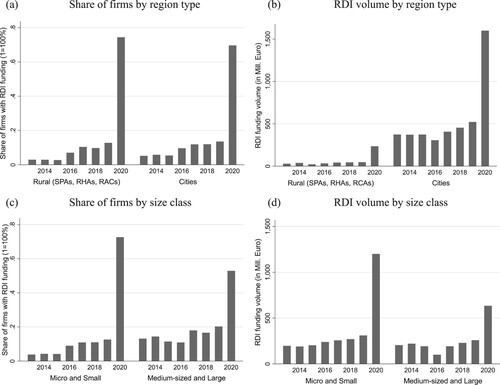
Figure 2. Spatial distribution of Business Finland funding across Finnish municipalities
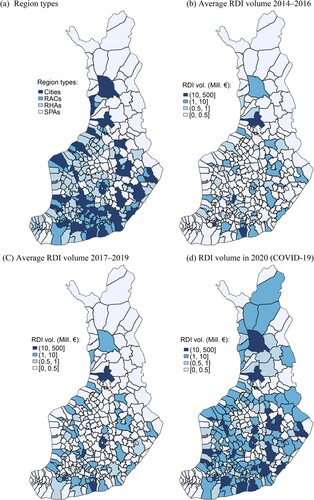
Table 2. Estimates of the geography of RDI funding receipt by Finnish firms before and during COVID-19.
Figure 3. Temporal development of predicted RDI funding volume by region type and size class.
Notes: Estimation results from FE Poisson regression; categorial variables have been merged to rural (=SPAs, RHAs and RACs) and small (=micro and small firms) to increase the readability of the figure. Predicted RDI volume is measured in logarithms; included control variables are measured at their mean values and firm-fixed effects are excluded from the predictions (as they drop out from the likelihood function of the FE Poisson estimator). The reference year for prediction of the effect of the categorial variables on received RDI funding volume is 2014.
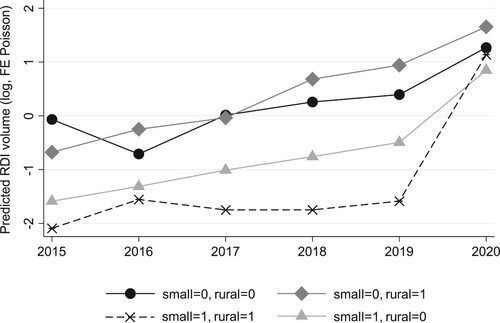
Figure 4. Sectoral differences in the increase in RDI funding volumes during COVID-19 in 2020.
Notes: Estimation results from FE Poisson regression for coefficient of interaction term composed of COVID-19 time dummy and sectoral aggregates as , where sectoral aggregates are defined as follows: A + B (agriculture and mining), C + F (construction and manufacturing), D + E + H (electricity, water and transportation), G (wholesale and retail trade), I + R (accommodation and food services and arts, culture and recreation), J + M + N (information and communication, professional and scientific services and administrative and support services), K + L + O + P + Q + S (other services). The sector aggregate A+B is used as reference category; firms with other activities or unknown industry have been excluded from the figure. Diamonds indicate point estimates; bars show 95% confidence intervals (relative to A+B as reference cat.).
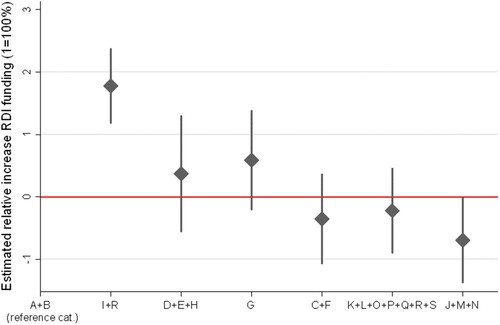
Table 3. Municipal-level estimates of the geography of RDI funding receipt before and during COVID-19.
Table A1. Descriptive statistics for variables in the aggregated municipal-level regressions (2013–2020).