Figures & data
Table 1. Examples for national or regional definitions for sparseness and remoteness (Source: Authors’ own compilation).
Figure 1. First-tier subnational units ranked on a log scale by population density (Source: Authors’ calculations based on data by GlobalDataLab.).
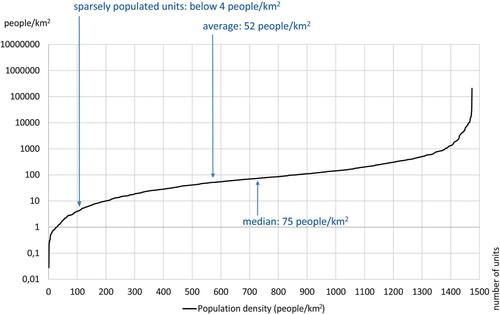
Figure 2. First-tier subnational (sparsely populated) jurisdictions below 4 persons/km2 density (Source: Calculation and cartographic design by the authors. ArcGIS shapefile provided by GADM).
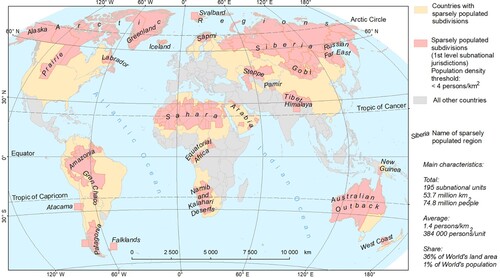
Table 2. Indicators for first-tier subnational units in the survey (Source: authors’ own).
Table 3. The extracted principal components (Source: Authors’ own calculations).
Figure 3. Scores of PC1 – Socio-economic performance factor (Source: Authors’ own calculations).
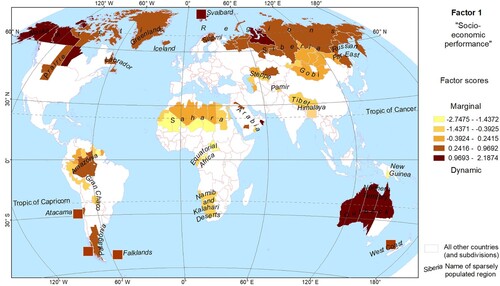
Figure 4. Scores the PC2 – Remoteness and otherness factor (Source: Authors’ own calculations).
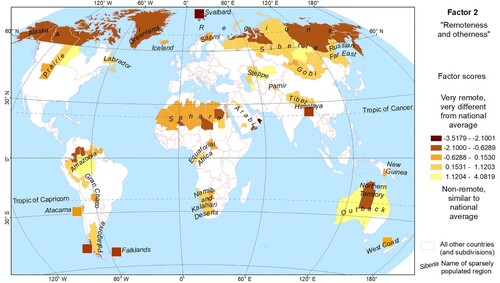
Figure 5. Three main types (clusters) of socio-economic patterns associated with SPAs (Source: Authors’ own calculations).
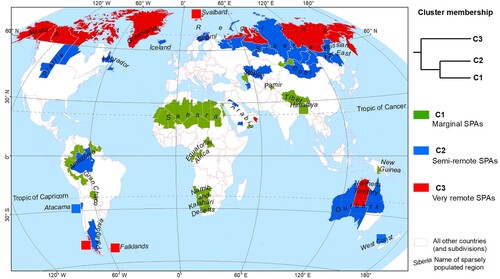
Table 4. Main characteristics of the three clusters and SPAs in general (Source: Authors’ own calculation).
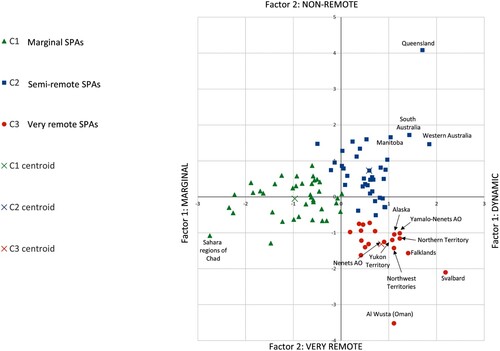
Figure 6. Cluster plot demonstrating the analysed units within the two dimensional factor-space (Source: Authors’ own).