Figures & data
Table 1. Detailed description of the variables and indicators adopted.
Table 2. Step-by-step progress of the clustering process – Iteration history table.
Table 3. Number of economic regions in each identified cluster.
Figure 1. Cluster means and the related contributions of each variable to the formation of the identified clusters.
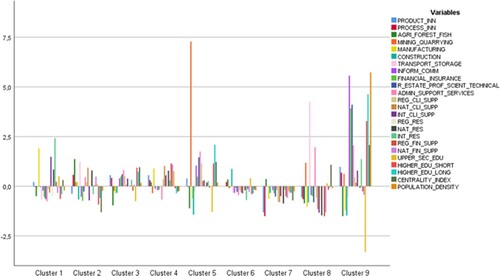
Figure 2. Share of economic regions aggregated at the county level in each cluster.
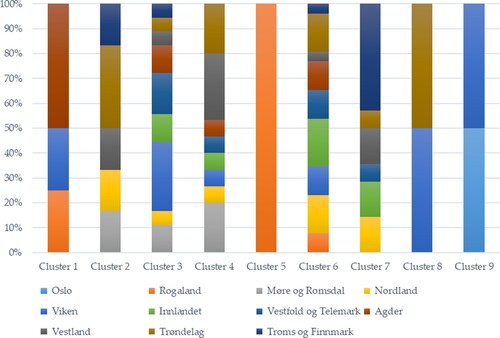
Table 4. Counties in the identified clusters. Legend – Yellow cell: No economic regions from the county in the respective cluster. Blue cell: At least one economic region from the targeted county in the respective cluster.
Table 5. Taxonomy of the Norwegian economic regions based on the selected innovation, economic and demographic indicators.
Table A1. ANOVA table including univariate F tests for each clustering variable.
Figure B1. Dendrogram used for preliminary identification of the optimal number of clusters. Method: Hierarchical clustering with Ward's minimum variance (Euclidean distance). The red horizontal line is the threshold for the identification of the clusters.
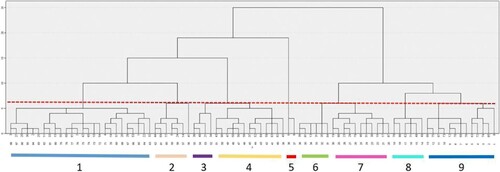
Figure C1. Kruskal-Wallis post hoc test – Variance within and between the identified clusters.
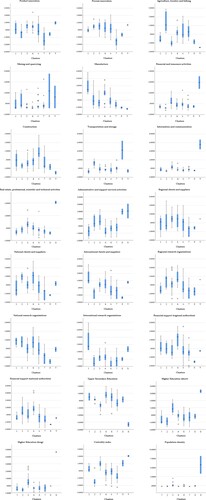
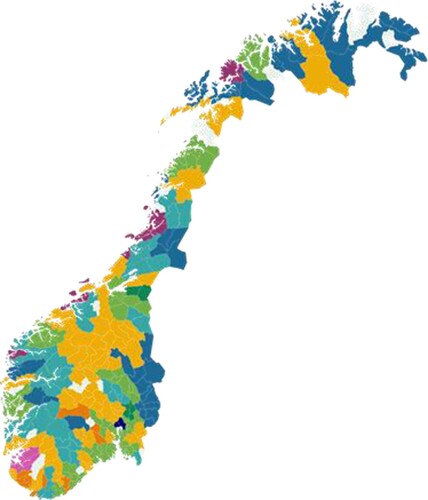
Figure D1. Distribution of the Norwegian economic regions in the nine identified clusters. Legend: Each colour identifies a given cluster. Map created with Flourish (https://flourish.studio/).