7,813
Views
34
CrossRef citations to date
0
Altmetric
Reviews

Investigation of L(+)-Ascorbic acid with Raman spectroscopy in visible and UV light

Figures & data

Figure 1. l-Ascorbic acid, C6H8O6 (systematic name (5R)-5-((1S)-1,2-dihydroxyethyl)-3,4-dihydroxyfuran-2(5H)-one), or here just AH2. The endiol group is the ‒C(OH)˭C(OH)‒ part of the ring with the double bond between C2 and C3. Other atom numbering systems have been used in the literature (4, 24–26, 43). The dihedral (torsional) angles are defined as shown for atoms A–B–C–D, with A nearest the observer, who is looking down the B–C bond. The angle is that between the projected bonds AB and CD (+ clockwise).
Figure 2. Raman cell for titration experiments in oxygen-free pure argon atmosphere.

Table 1 Selected structure data in solved crystal structures compared to DFT calculateda results for AH2, AH, and A2−

Figure 3. Ascorbic acid molecule, AH2, as optimized by us starting from Hvoslef's average crystal structure (25). Calculations done with the Gaussian minimization procedure using DTF/B3LYP/G6-311++(d,p) with the water as solvent in the PCM solvation modeling. This is a local but not the global minimum of the single-molecule.
Figure 4. Most stable structure of the ascorbic acid molecule, AH2, as optimized by Gaussian minimization with the DTF/B3LYP/G6-311++(d,p) procedure and using water as the solvent in the PCM solvation modeling. The structure is reminiscent of that found in the gas phase by Milanesio et al. (26), Singh et al. (53), and Yadav et al. (54).

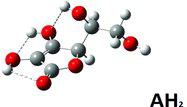
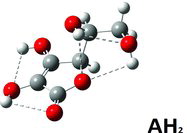
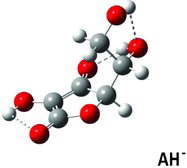
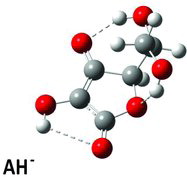
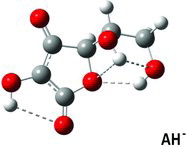
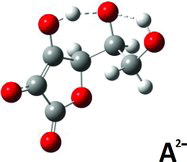
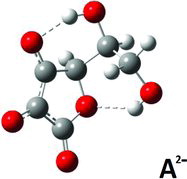
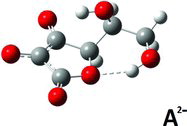
Table 2 Intramolecular hydrogen bond distances for AH2, AH, and A2− molecules in different minimizeda conformations

Figure 5. Optimized structure of the AH ion in the PCM water model as obtained after Gaussian minimization based on our guess. This global minimum conformer of AH has three internal hydrogen bonds (Table 2).
Figure 5. Optimized structure of the AH− ion in the PCM water model as obtained after Gaussian minimization based on our guess. This global minimum conformer of AH− has three internal hydrogen bonds (Table 2).
Figure 6. Optimized structure of the AH ion in the PCM water model as obtained after Gaussian minimization based on the crystal structures solved by Hvoslef (10). This local minimum conformer of AH has three internal hydrogen interactions but the energy is not as low as that of Figure 5 (Table 2).
Figure 6. Optimized structure of the AH− ion in the PCM water model as obtained after Gaussian minimization based on the crystal structures solved by Hvoslef (10). This local minimum conformer of AH− has three internal hydrogen interactions but the energy is not as low as that of Figure 5 (Table 2).
Figure 7. Optimized structure of the AH ion in the PCM water model as obtained after Gaussian minimization based on the results of Singh et al. (53) and Yadav et al. (54) for AH2. This local minimum conformer of AH has four internal hydrogen interactions but the energy is not as low as that of Figure 5 (Table 2).
Figure 7. Optimized structure of the AH− ion in the PCM water model as obtained after Gaussian minimization based on the results of Singh et al. (53) and Yadav et al. (54) for AH2. This local minimum conformer of AH− has four internal hydrogen interactions but the energy is not as low as that of Figure 5 (Table 2).

Table 3 Calculated dihedral (torsion) angles χ1, χ3–χ6 for the ascorbate ion minimum energy conformer (Figure 5) compared with similar angles in selected crystal structuresa

Figure 8. Optimized structure of the A2− ion in the PCM water model as obtained after Gaussian minimization based on a guess. This local minimum conformation of A2−, rather similar to a similar gas-phase conformer (Table 1), has two internal hydrogen interactions but the energy is not as low as that in Figure 9 (Table 2).
Figure 9. Optimized structure of the A2− ion in the PCM water model as obtained after Gaussian minimization starting from a guessed structure derived from the crystal results by Hvoslef (10, 25). This global minimum conformer of A2− has two internal hydrogen bonds (Table 2).
Figure 10. Optimized structure of the A2− ion in the PCM water model as obtained after Gaussian minimization based on a guessed structure derived from the results for AH2 of Singh et al. (53) and Yadav et al. (54). This local minimum conformer of A2− has one internal hydrogen interaction and the Ho5 is interacting with the π electrons above C3, but the stabilization is not as good as in the conformer of Figure 9 (Table 2).
Figure 11. Raman and infrared spectra calculated for the conformer of ascorbic acid AH2 simulated in water solution for the local minimum conformation as shown in Figure 3.

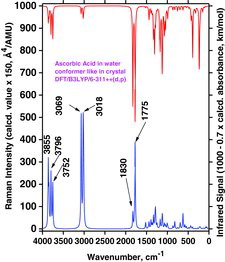
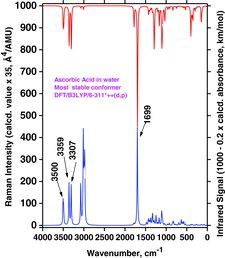
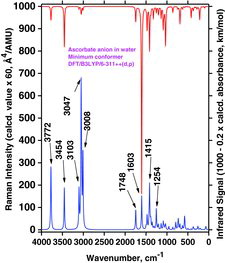
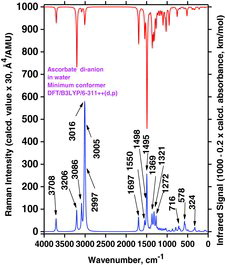
Table 4 Selected wavenumber dataa for IR absorption and Raman scattering strong bands of AH2, AH, and A2− compounds dissolved in water. Data were calculated by the Gaussian 03/DFT/B3LYP/6-311++G(d,p)/PCM

Table 5 Selected model results for ions AH and A2− in water (PCM)a,b

Figure 12. Raman and infrared spectra calculated for the most stable ascorbic acid AH2 simulated in water solution for the conformation as shown in Figure 4.
Figure 13. Raman and infrared spectra calculated for the ascorbate ion AH simulated in water solution for the conformation as shown in Figure 5.
Figure 13. Raman and infrared spectra calculated for the ascorbate ion AH− simulated in water solution for the conformation as shown in Figure 5.
Figure 14. Raman and infrared spectra calculated for the ascorbate di-anion A2− simulated in water solution for the conformation as shown in Figure 9.
Figure 15. Reference Raman spectra for AH2 and NaAH solids. Measurement details: Laser, 532 nm. Power level, ∼200 mW. Slit width, ∼8 cm−1. Accuracy, ± 1 cm−1. Assignments are given in Table 6. Insert shows details of the range from 1800 to 1400 cm−1.

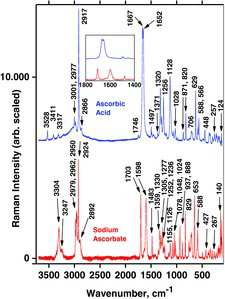
Table 6 Measured Raman spectral bands (in cm−1) and assignments for ascorbic acid and sodium ascorbate solids, compared to literature values (39, 44–46, 48). Some data can also be found in Jehlička et al. (Citation47)

Figure 16. Measured and calculated Raman spectra for ascorbic acid. Top: AH2 in concentrated aqueous solution, measured with 488 and 532 nm laser lines. The spectrum of water is included for reference (532 nm). Middle: AH2 powder measured with excitation wavelength 532 nm. Bottom: Calculated spectrum for the most stable conformer (see Figure 4) as found by Gaussian modeling within a PCM water model. Assignments are given in Table 7.

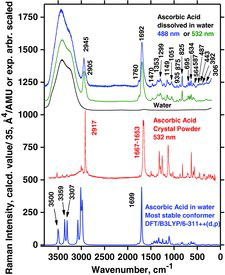
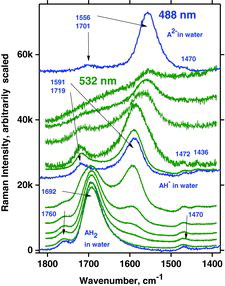
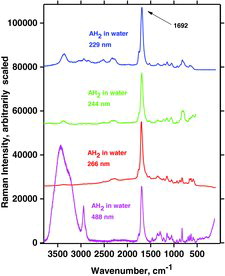
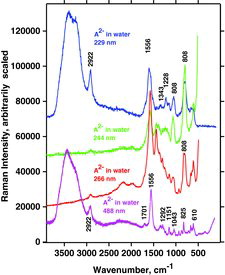
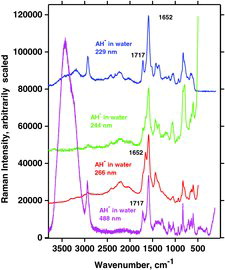
Table 7 Measured Raman spectral bands (in cm−1) and assignments for aqueous solutions of ascorbic acid and sodium ascorbates, compared to literature values (39, 44, 46, 48). Some data can be found in Jehlička et al. (Citation47). Water bands are not included. For abbreviations, see Table 6

Figure 17. Dependence of Raman spectra of AH2 solution on polarization, as obtained with 532 nm excitation on the DILOR-XY instrument. VV and VH refer to vertically (V) polarized incoming beam being analyzed with a sheet polarizer (V and H) after 90° of horizontal (H) scattering. The temperature was 24°C.
Figure 18. Raman spectra of normal and deuterated (D2O/H2O = ∼90%) aqueous AH2 solutions, as obtained with 532 nm on the DILOR-XY instrument. Solutions were freshly made and recorded at 24°C within 1 h after preparation.
Figure 19. Comparison of ascorbate AH Raman spectra, obtained from an aqueous solution, from a crystalline powder sample, and as calculated.
Figure 19. Comparison of ascorbate AH− Raman spectra, obtained from an aqueous solution, from a crystalline powder sample, and as calculated.
Figure 20. Raman spectra versus titration experiments on ascorbic acid dissolved in water. Bottom: Neat solution of ascorbic acid in oxygen poor water (pH = ∼2). Middle and top: After addition of the calculated amounts of NaOH solution, NaAH, and Na2A solutions were formed (middle, pH = ∼9, and top, pH = >12). Laser excitation: 488 nm. Spectrometer: DILOR-XY.
Figure 21. Titration experiments on ascorbic acid dissolved in water after increasing amounts of NaOH solution, done with 532 and 488 nm laser excitation and the DILOR-XY instrument. Bottom: Neat solutions of ascorbic acid in water (pH ∼2). Top: Spectra versus increasing additions of base (to pH = >12).
Figure 22. Experimental Raman spectra of ascorbic acid in aqueous solution versus excitation wavelength (pH = ∼2).
Figure 24. Experimental Raman spectra of A2− in aqueous solution versus excitation wavelength (pH = >12).
Figure 25. Vibrational modes labeled A, B, and C of ascorbic acid molecules AH2, AH, and A2−.
Figure 25. Vibrational modes labeled A, B, and C of ascorbic acid molecules AH2, AH−, and A2−.

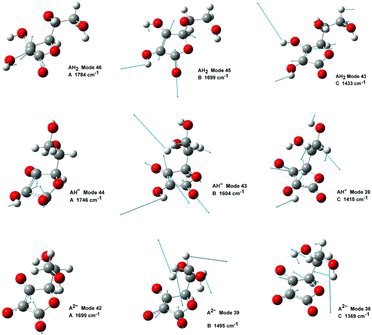
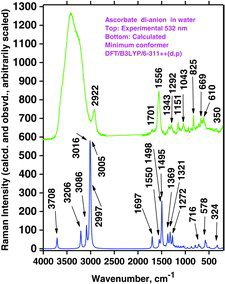
Table 8 Wavenumber values (cm−1) and calculated Raman intensity (int, in units of Å2/amu) of vibration bands A, B, and C for AH2, AH, and A2− in water. Observed wavenumber values (Obsd.) from Table 7. For intensity abbreviations see Table 6

Figure 23. Experimental Raman spectra of ascorbate in aqueous solution versus excitation wavelength (pH = ∼9).
Figure 26. Raman spectra of A2−: Experimental results in freshly made solution compared to the DFT calculated result for ion in water solvent (PCM).
Figure 27. Typical absorption spectra as obtained during titration.

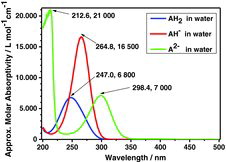
Table 9 Ultraviolet absorption data of ascorbic acid species; see Figure 27