27,483
Views
15
CrossRef citations to date
0
Altmetric
Reviews

Measuring and tracking vitamin B12: A review of current methods with a focus on optical spectroscopy

, , &

Figures & data

Figure 1. Chemical structure of the basic form of vitamin B12 (cobalamin). Some of its most common derivatives consist of R = –CN (cyanocobalamin), R = –OH (hydroxycobalamin) and R = –CH3 (methylcobalamin).
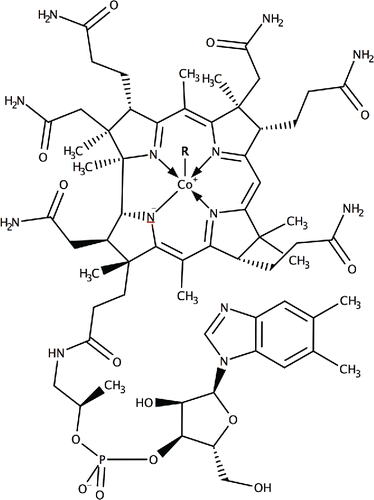
Figure 1. Chemical structure of the basic form of vitamin B12 (cobalamin). Some of its most common derivatives consist of R = –CN (cyanocobalamin), R = –OH (hydroxycobalamin) and R = –CH3 (methylcobalamin).

Figure 2. Standard ELISA curve for derivatized vitamin B12 versus vitamin B12. Each point represents the mean of 20 determinations. Vertical bars indicate error bars with 5% value (taken from Citation(43)).
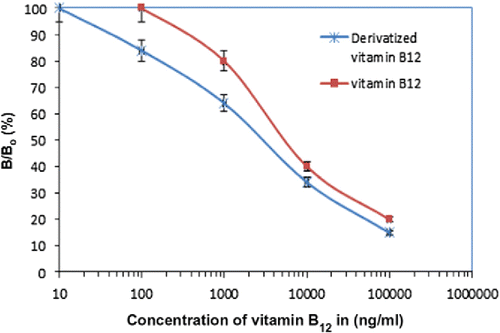
Figure 2. Standard ELISA curve for derivatized vitamin B12 versus vitamin B12. Each point represents the mean of 20 determinations. Vertical bars indicate error bars with 5% value (taken from Citation(43)).

Figure 3. A signature of two different cobalamin compounds in a liquid sample as analyzed by capillary electrophoresis (taken from Citation(57)).
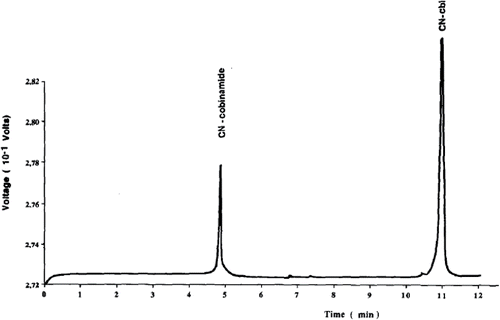
Figure 3. A signature of two different cobalamin compounds in a liquid sample as analyzed by capillary electrophoresis (taken from Citation(57)).

Figure 4. Concentration series for detection of vitamin B12 based on chemiluminescence in two different sensing modes (with pre-acidification of vitamin B12 taking place within and outside the microfluidic system, respectively) for a lab-on-a-chip device (taken from Citation(88)).
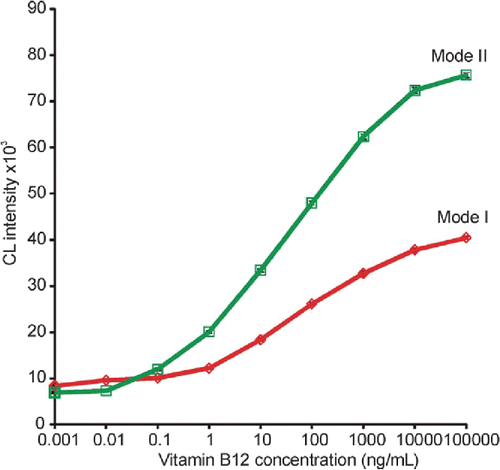
Figure 4. Concentration series for detection of vitamin B12 based on chemiluminescence in two different sensing modes (with pre-acidification of vitamin B12 taking place within and outside the microfluidic system, respectively) for a lab-on-a-chip device (taken from Citation(88)).

Figure 5. Fluorescence spectra using 454 nm argon laser (10 mW) as the excitation source. (a) aridine orange (AO); (b) Rhodamine 6G (R6G); (c) R6G–AO; (d) Mixture of R6G–AO and vitamin B12 (VB12) (concentrations of AO, R6G and VB12 are 1 × 10⁻⁵, 4 × 10⁻⁵ and 4 × 10⁻⁶ mol/L, respectively for (a–d)) (taken from Citation(94)).
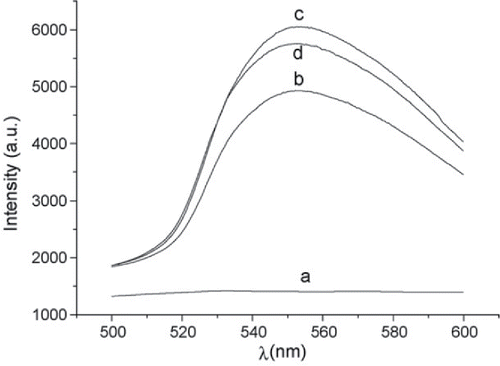
Figure 5. Fluorescence spectra using 454 nm argon laser (10 mW) as the excitation source. (a) aridine orange (AO); (b) Rhodamine 6G (R6G); (c) R6G–AO; (d) Mixture of R6G–AO and vitamin B12 (VB12) (concentrations of AO, R6G and VB12 are 1 × 10⁻⁵, 4 × 10⁻⁵ and 4 × 10⁻⁶ mol/L, respectively for (a–d)) (taken from Citation(94)).

Figure 6. Raman spectrum of vitamin B12 powder (taken from Citation(125)).
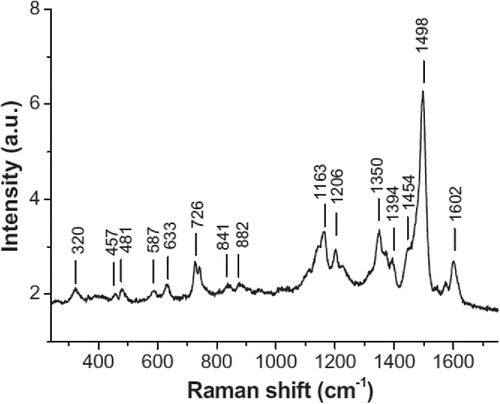
Figure 6. Raman spectrum of vitamin B12 powder (taken from Citation(125)).

Table 1. Limit of detection (LOD) and advantages and disadvantages of optical spectroscopy techniques used for measurements of vitamin B12.