Figures & data
Figure 1. Creation of tissue-engineered skin models (A). Modification of method to create TE-skin wound models by seeding keratinocytes and fibroblasts between concentric steel rings (B).
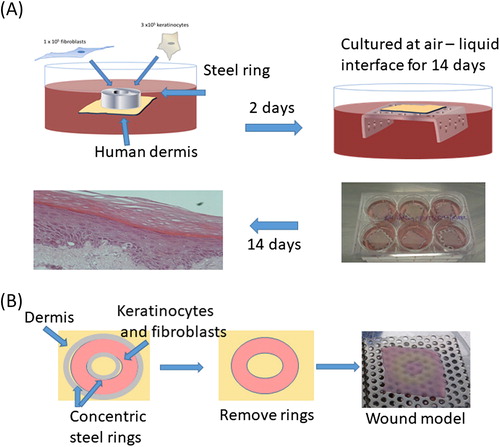
Figure 2. A. Incisional cut wounds in tissue-engineered skin models at 1, 7, and 14 d post-wounding (i, ii, and iii). H&E sections (iv, v, and vi) and Pancytokeratin immunostaining (seen as green) with DAPI nuclear staining (seen as blue) (vi, vii, and viii) of those wounds at days 1, 7, and 14. B. Gram-stained histology sections of the mature tissue-engineered skin which is either uninfected (i) or infected with P. aeruginosa (ii) or S. aureus (iii) for 24 h (×100 magnification). Insets show higher magnification (×400).
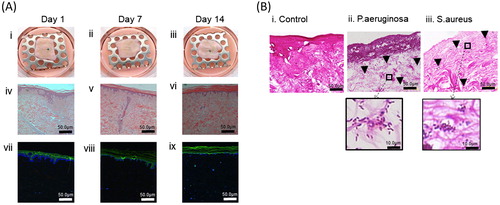
Figure 3. Raman traces showing peaks at 968 and 1074 for pH 4 and 7, respectively (A). Graph of pH data calculated from Raman data (100 spectra) for saline buffered at pH 4, 7, and 10 (B). Principle component analysis plots of derived from spectra in the range 950–1080 cm−1 comparing pH4 (red) and pH7 (blue) (A), and comparing pH 9 (red) and pH 7 (blue) (C).
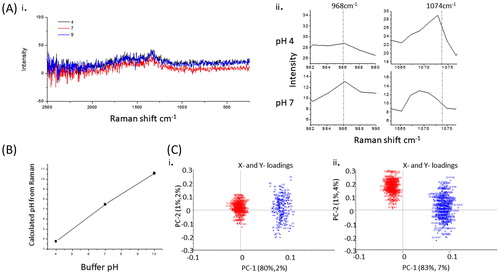
Figure 4. H&E histology and corresponding pH data calculated from Raman data of control (A & B), and wound model TE-skin (C & D). Samples stained with H&E are ×100 magnification, scale bar represents 100 µm, n = 3.
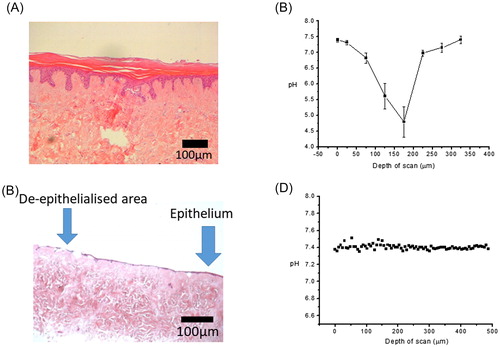
Figure 5. H&E histology of TE-skin treated for 7 d with Il-17, Control (A), 2 ng/ml (B), and 20 ng/ml (C). H&E histology of TE-skin treated with Il-17 (D), and pH measurements calculated from Raman data (E). Samples are stained with H&E are ×100 magnification, scale bar represents 100 µm, n = 3.
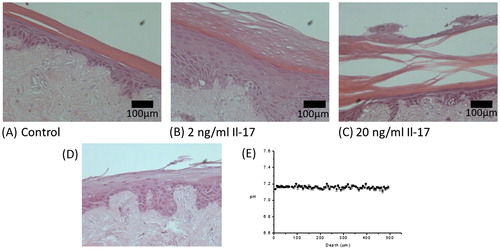
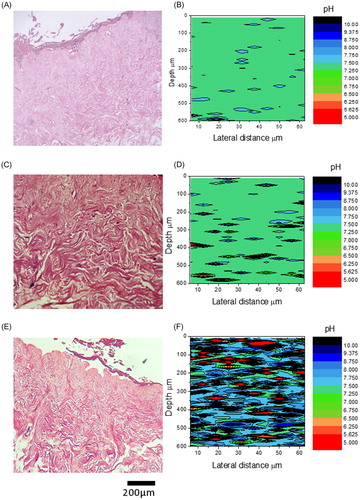
Figure 6. Measurement of pH in bacterially infected skin. H&E sections (A, C, & E) and pH plots (B, E, & F) of sections through control TE-skin (A&B), S. aureus infected (C&D), and P. aeruginosa infected (E & F) TE-skin. ×100 magnification, scale bar represents 200 µm, n = 3.