Figures & data
Figure 1. Flow chart of the bibliometric analysis.
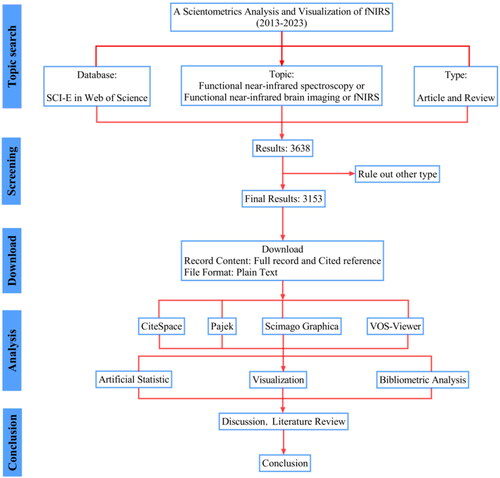
Figure 2. Annual publications between 2013 and 2023.
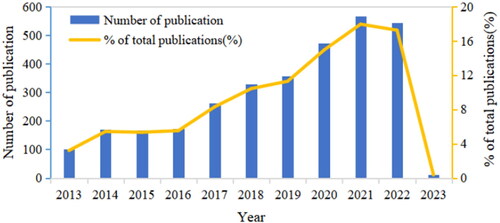
Figure 3. Cooperation map of countries/regions.
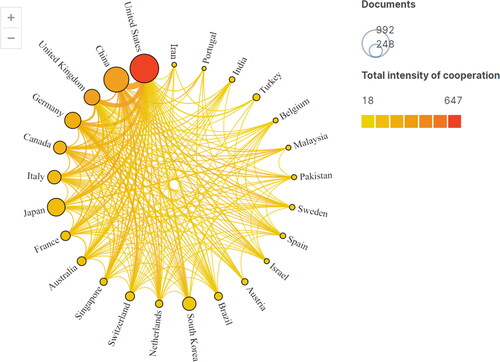
Table 1. Top 10 countries with the highest number of publications and their centrality.
Figure 4. Cooperation map of institutions.
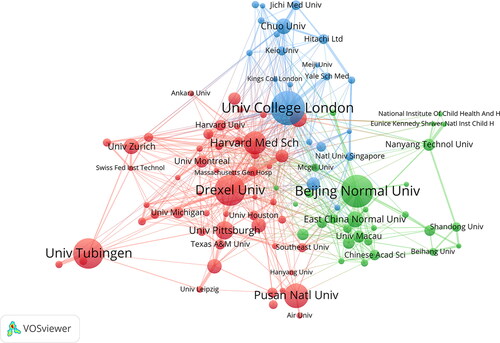
Figure 5. Cooperation map of authors.
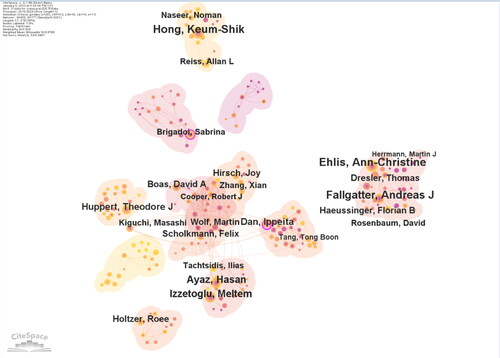
Table 2. Top 10 authors with the highest number of publications and citations.
Figure 6. Co-citation knowledge map.
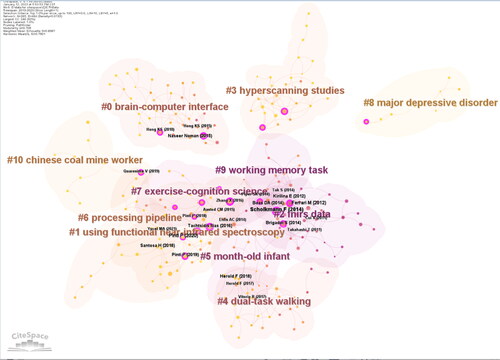
Table 3. Highly co-cited literature on fNIRS research.
Figure 7. Top 20 keywords with the strongest citation bursts.
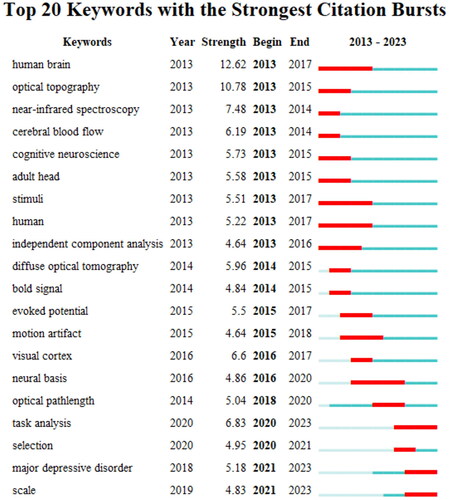
Figure 8. Knowledge map of keyword clustering analysis.
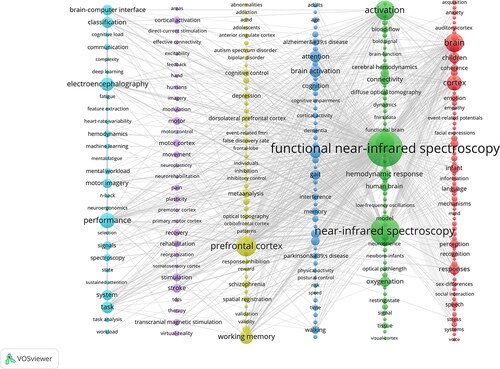
Table 4. Top 10 high-frequency keywords.
Figure 9. Distribution of light sources, detectors and channels.
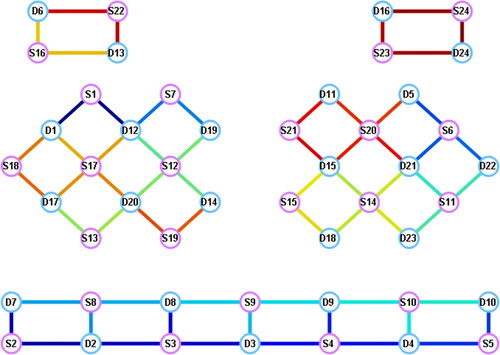
Figure 10. fNIRS task-state design paradigm.
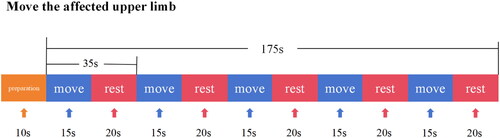
Figure 11. Plot of Hbo concentration change after task-state block averaging.
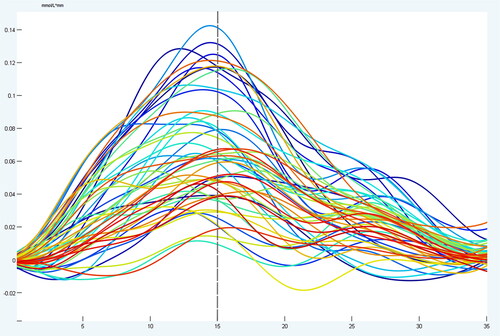
Figure 12. Brain functional connectivity mapping and matrices in the resting state.
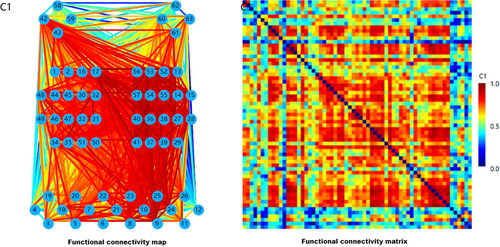
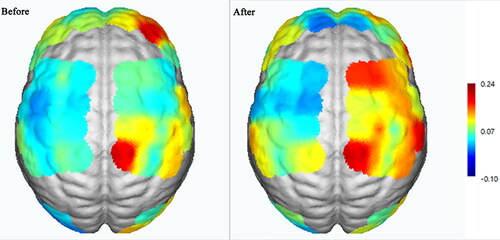
Figure 13. Changes in activation of task-state brain regions before and after treatment.