1,222
Views
12
CrossRef citations to date
0
Altmetric
Articles

Establishment of channel networks in a digital elevation model of the prairie region through hydrological correction and geomorphological assessment

, &
Pages 12-23 | Published online: 28 Mar 2013

Figures & data

Figure 1 Original DEM of the selected flat region.

Figure 1 Original DEM of the selected flat region.

Figure 2 Corrected DEM by the IMQ method.

Figure 2 Corrected DEM by the IMQ method.

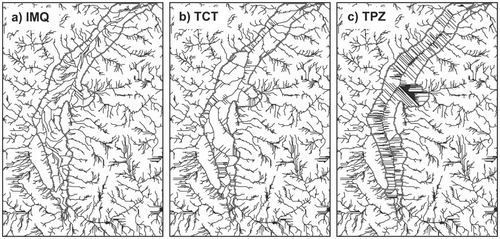
Figure 3 Channel networks derived from a) the IMQ method, b) the TCT method, and c) the TPZ method.

Figure 3 Channel networks derived from a) the IMQ method, b) the TCT method, and c) the TPZ method.

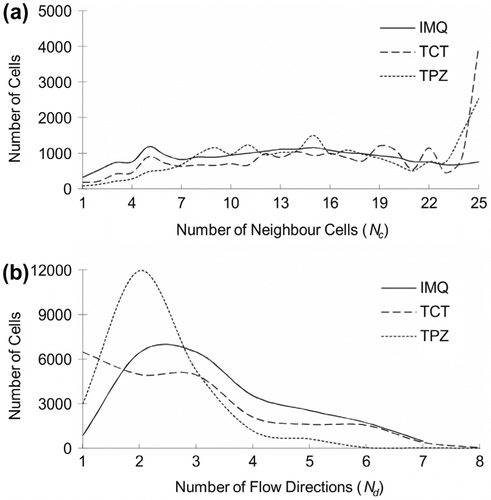
Figure 4 Heterogeneity analyses of flow direction rasters using (a) Nc and (b) Nd .

Figure 4 Heterogeneity analyses of flow direction rasters using (a) Nc and (b) Nd .

Figure 5 Contours of hydrological distance derived from a) the IMQ method, b) the TCT method an c) the TPZ method.
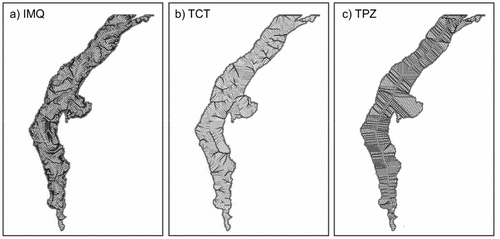
Figure 5 Contours of hydrological distance derived from a) the IMQ method, b) the TCT method an c) the TPZ method.

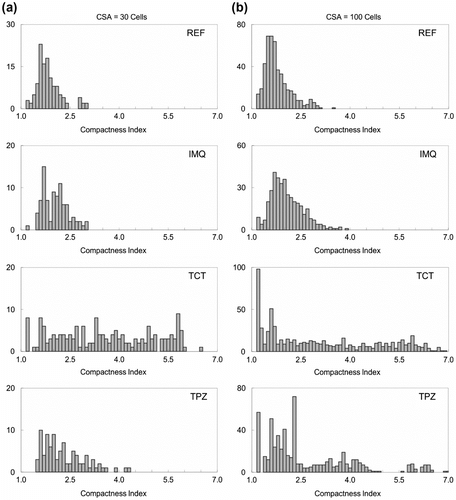
Figure 6 Histograms of Compactness Index for a) CSA = 100 cells and b) CSA = 30 cells.

Figure 6 Histograms of Compactness Index for a) CSA = 100 cells and b) CSA = 30 cells.

Figure 7 Drainage density of first-order channels derived from a) the reference regions, b) the IMQ method, c) the TCT method, and d) the TPZ method.
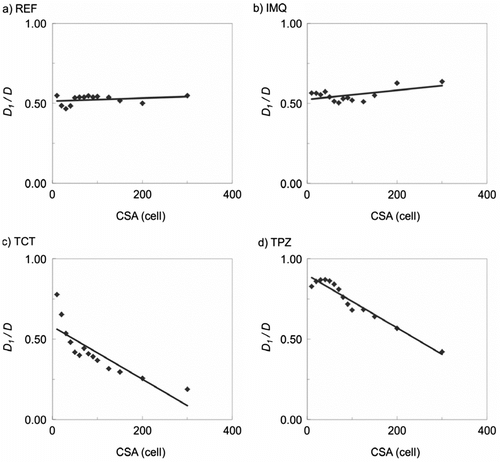
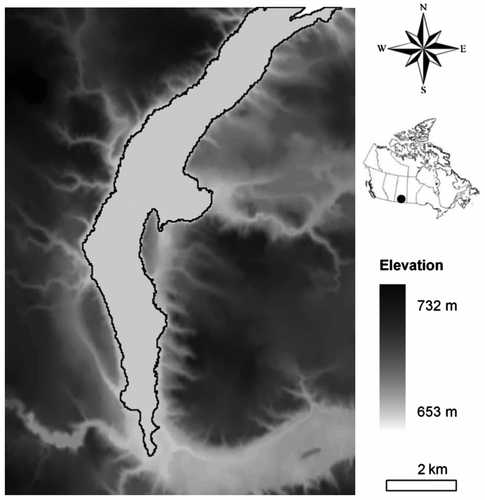
Figure 7 Drainage density of first-order channels derived from a) the reference regions, b) the IMQ method, c) the TCT method, and d) the TPZ method.
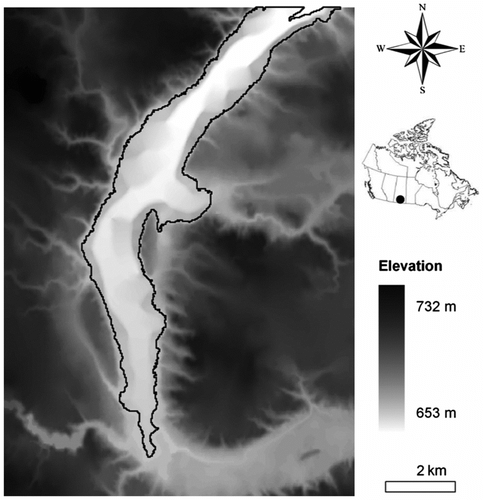
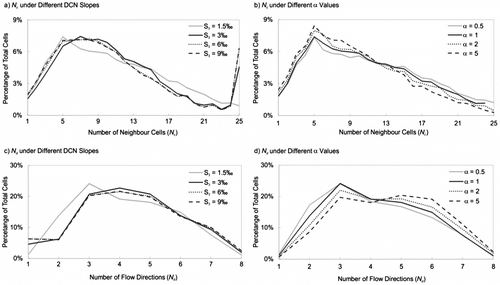
Figure 8 Heterogeneity analysis of flow direction rasters for different a) DCN slopes and b) α values.

Figure 8 Heterogeneity analysis of flow direction rasters for different a) DCN slopes and b) α values.

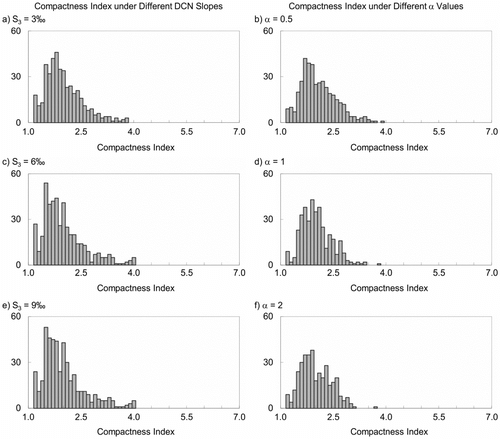
Figure 9 Histograms of Compactness Index for different DCN slopes and different α values.

Figure 9 Histograms of Compactness Index for different DCN slopes and different α values.

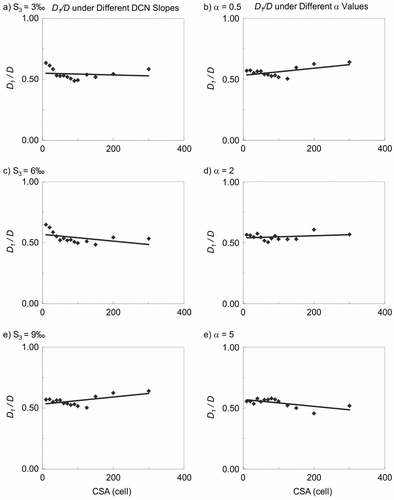
Figure 10 Drainage density of first-order channels associated with different DCN slopes and different α values.

Figure 10 Drainage density of first-order channels associated with different DCN slopes and different α values.

Reprints and Corporate Permissions

Please note: Selecting permissions does not provide access to the full text of the article, please see our help page How do I view content?

To request a reprint or corporate permissions for this article, please click on the relevant link below:

Academic Permissions

Please note: Selecting permissions does not provide access to the full text of the article, please see our help page How do I view content?

Obtain permissions instantly via Rightslink by clicking on the button below:

If you are unable to obtain permissions via Rightslink, please complete and submit this Permissions form. For more information, please visit our Permissions help page.