Figures & data
Figure 1 (a) Natural disasters in Canada since 1900; (b) frequency of flood disasters [Public Safety Canada (PSC) 2010].
![Figure 1 (a) Natural disasters in Canada since 1900; (b) frequency of flood disasters [Public Safety Canada (PSC) 2010].](/cms/asset/29647890-582a-41b2-a1cd-be7fea68fddf/tcwr_a_801599_f0001_b.gif)
Figure 2 Schematic representation of the hazards, inventory, damage functions, and risks in Hazus. In grey are characteristics of the Hazus Flood model. Characters in bold represent options currently available to Canadian users.
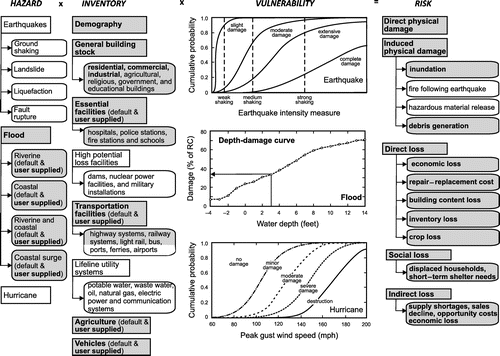
Figure 3 Schematic representation of the hazard parameters for a typical Canadian house with a basement [1st floor in Hazus]. Depth-damage functions are applied to relevant depth of flooding (depth in structure).
![Figure 3 Schematic representation of the hazard parameters for a typical Canadian house with a basement [1st floor in Hazus]. Depth-damage functions are applied to relevant depth of flooding (depth in structure).](/cms/asset/3964b9a5-6221-4575-aa5d-9bfe0b2d8fd2/tcwr_a_801599_f0003_b.gif)
Table 1. Census block size in Canada and in the US.