Figures & data
Table 1. Steps of framework for ecological flows and water levels.
Figure 1 Lovers Creek subwatershed physical and biological characteristics.
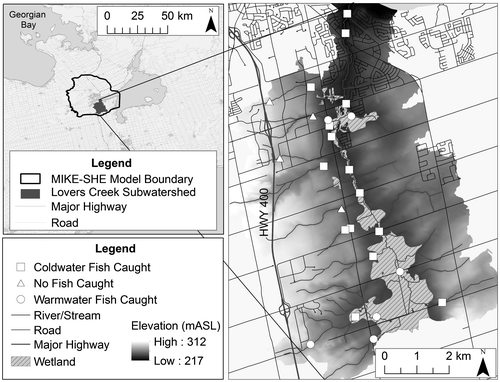
Figure 2 Land cover within the contributing area of each analysis node. LOV, Lovers Creek sites; CWT, Central Western Tributary site.
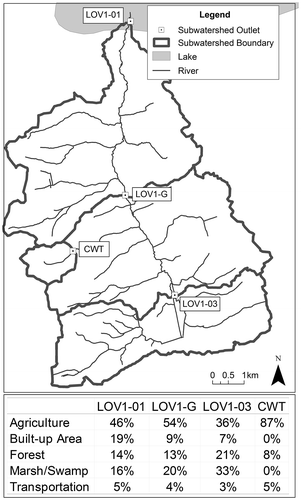
Table 2. Translation of general goals to limiting needs (adapted from Al Zaghal 2010).
Table 3. Functional flow assessment for Lovers Creek streamflow points.
Table 4. Basic streamflow statistics for all streamflow sites. LOV, Lovers Creek sites. CWT, Central Western Tributary.
Figure 3 Median monthly flow and median monthly flow Coefficient of Dispersion (CD) for all study nodes. LOV, Lovers Creek sites.
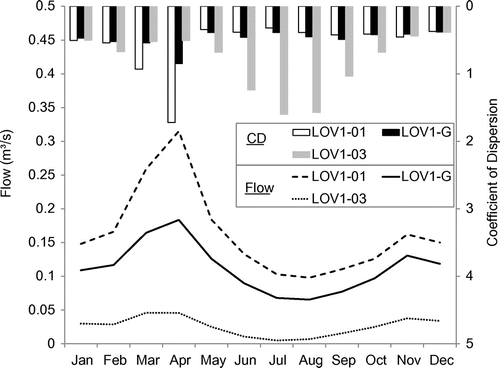
Figure 4 Comparison of modelled pre-settlement and current hydrologic regime flow duration curves for site LOV1-01. LOV, Lovers Creek sites.
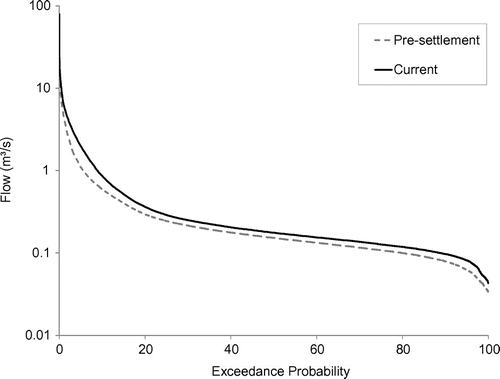
Figure 5 Ecological model describing flow magnitude and timing of important ecological functions for site LOV1-01. LOV, Lovers Creek sites.
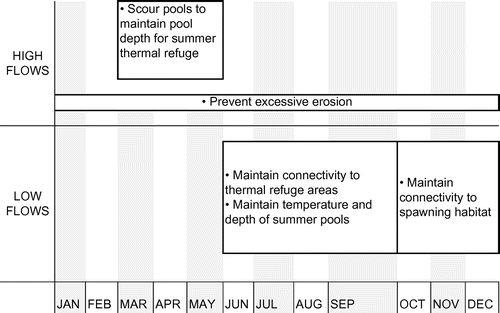
Figure 6 Example calculation of the hydrologic alteration factor statistic, which is used as a target for overall ecosystem health.
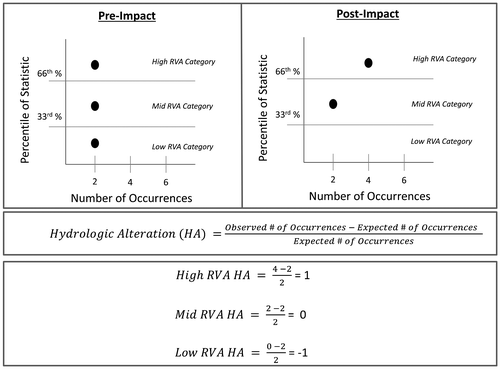
Table 5. Table relating flow objectives to information required for quantification of flows.
Figure 7 An example of Environmental Flow Component (EFC) flow ranges. The horizontal lines on the hydrograph represent thresholds that separate each EFC.
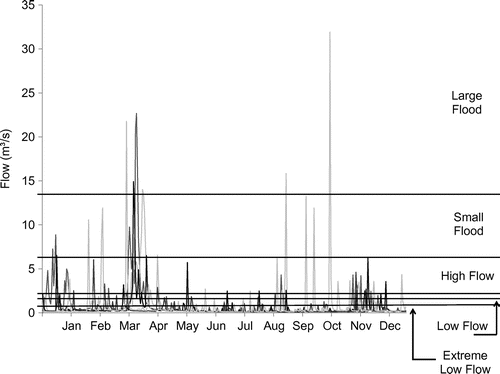
Figure 8 The four types of ecological targets based on the direction of flow magnitude change and whether crossing the flow threshold is desired or not desired.
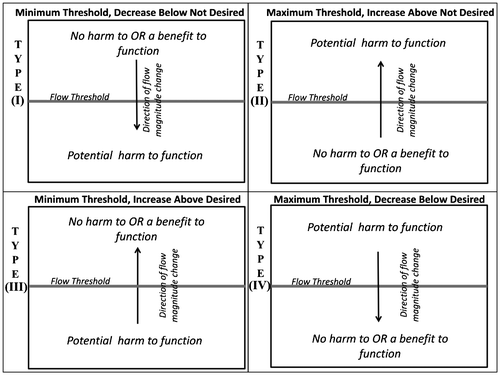
Table 6. Flow targets for ecological objectives. EFC, Environmental Flow Component.
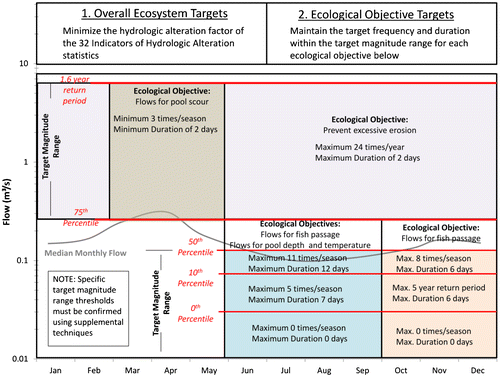
Figure 9 Target flow regime for site LOV1-01. LOV, Lovers Creek sites