Figures & data
Figure 1. Location of the Okanagan Valley straddling the Canada–US border between British Columbia and Washington State (inset); locations of the Okanagan watershed boundary, valley-bottom lakes and key environmental monitoring sites are also identified (main figure). Kelowna, with 106,000 people, is the largest urban centre with extensive riparian infrastructure, followed by Penticton (31,909), Okanagan Falls (6005), Osoyoos (4845) and Oliver (4370).
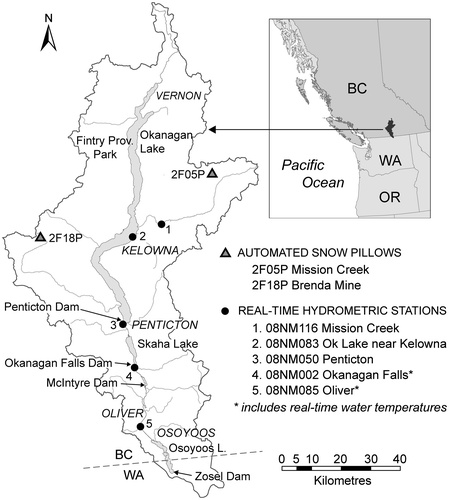
Table 1. Preferred fishery flows, for the Okanagan River at Oliver, BC, and recommended within the Okanagan Basin Water Agreement of 1982.
Figure 2. Timing of sockeye salmon life-history stages (adult migration, spawning, egg/alevin incubation and fry emergence) and seasonal changes in recommended flow ranges (shaded rectangles) for the Okanagan River at Oliver under the 1982 Okanagan Basin Implementation Agreement. Seasonal hydrographs for a near-average year, the flood of record (1996–1997) and the drought of record (1930–1931) also indicate seasonal to annual intervals during which water managers must consider the impacts of drought, flood, or both drought and flood conditions.
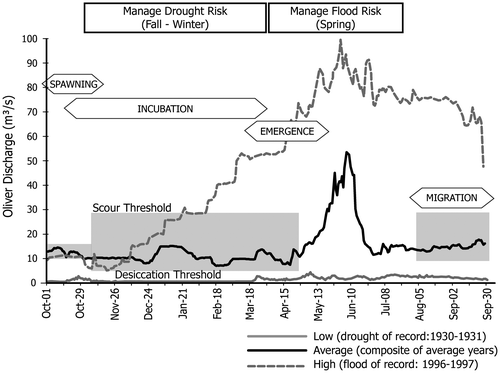
Figure 3. Boundaries for the five river and lake segments within the Okanagan Basin explicitly considered by the Fish and Water Management Tool. Bullet points summarize the focus and timing of fish and water management objectives that must be considered within each geographic segment. Urban infrastructure is concentrated in cities and towns already identified (see Figure 1), while the economic value of this infrastructure is approximately proportional to the size of their resident populations (see Figure 1 legend).
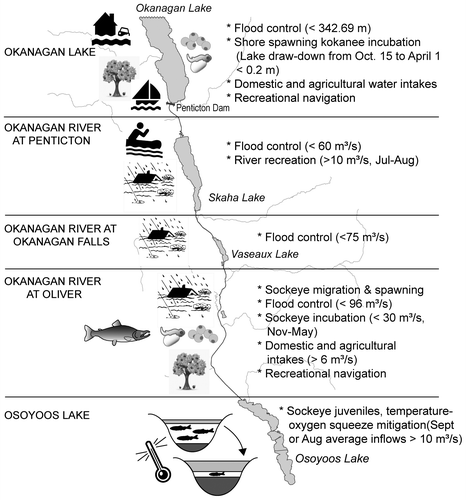
Figure 4. Comparisons of British Columbia River Forecast Centre predicted versus observed water inflows to Okanagan Lake on each of 1 February, 1 March, 1 April and 1 May over a 29-year interval. Forecasts provided in February and March are not given more weight than reference to the all-year average in making late winter to early spring management decisions, but preference is given to April and May forecasts, which explain enough of the observed annual discharge variance to be useful.
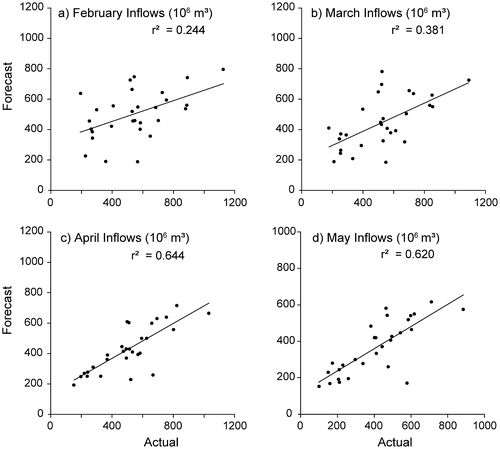
Table 2. Principal Okanagan Lake and River System (OLRS) management objectives identified by category during interdisciplinary workshops to design the Okanagan Fish and Water Management Tool (FWMT) decision support system (DSS).
Figure 5. The Fish and Water Management Tool (FWMT) model is a coupled set of four biophysical sub-models (1,3,4,5) of key relationships (among climate/hydrology, fish, water and property) that interact with a fifth, water management “rules” sub-model (2) used to predict the consequences of water management decisions for fish and other water users. FWMT software allows system users to explore water management decision impacts by employing current data (current mode), historic data (retrospective mode) or synthetic, future data (prospective mode) pertaining to water supplies, climate and fish life-history states (6,7,8). Sockeye salmon smolt-to-adult return rates (SAR) are used outside of the model to anticipate future abundance changes.
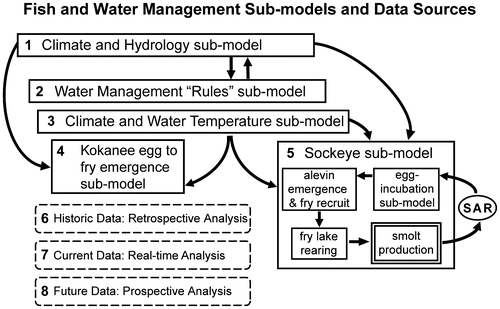
Table 3. Fish and Water Management Tool (FWMT) “looking outward” matrix. Each element in the matrix represents a transfer of information between subsystems, from a row to a column.
Figure 6. A summary of the work flow for Fish and Water Management Tool software users (Alexander et al. Citation2008).
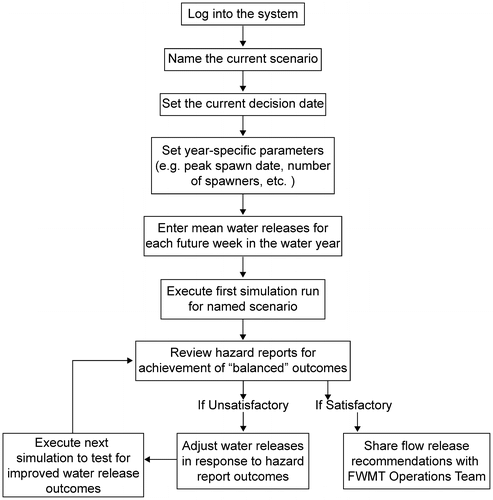
Figure 7. Modified version of a screensaver shot of the main entry form that allows users to name a scenario, enter year-specific parameters for kokanee and sockeye salmon, propose water releases at weekly intervals for the remainder of a given water year (water year starts 1 September of year n and ends 31 August of year n + 1). Users have discretion over sharing scenario inputs and outcomes with other system users.
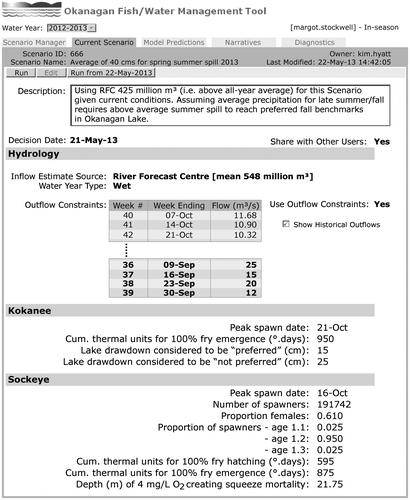
Table 4. Summary of key events or activities, risk factors or processes, and indicators of relevance for users of the Okanagan Fish and Water Management Tool (FWMT) decision support system. The majority of indicators are generated within the FWMT system as model predictions (P) or measured observations (O) that are imported in near real-time. Stars (❖) represent the primary indicators used for ongoing evaluation of changes in risk. Circles (o) represent a subset of detailed indicators. A smaller set of supplemental indicators are generated and accessed by users from outside of the FWMT application (see text for further explanation).
Figure 8. (a) Okanagan Lake segment of screen display presented to Fish and Water Management Tool (FWMT) users upon opening the multiple objective hazard assessment (MOHA) report. Water management performance indicators informing decisions for Okanagan Lake include: foreshore flood control, domestic water intake integrity, launching ramp and dock integrity, navigation ease and kokanee egg/alevin risk of desiccation. The solid black line identifies lake elevations to date. The solid blue line identifies simulated, lake-level outcomes associated with a proposed set of water releases. Green diamonds are preferred benchmarks for maintenance of seasonal water levels as defined by the Okanagan Basin Implementation Agreement (OBIA). The yellow triangle in late April is an alternate lake-level benchmark (as defined by the Okanagan Basin Agreement [OBA]) given certainty of high freshet and flood risk if late April snowpack is far above average. The yellow triangle in late October is the preferred lake elevation benchmark for fall spawning by kokanee on Okanagan Lake beaches. Green, amber and red segments of indicator bars follow low, moderate and high risk classifications of lake elevations associated with failure to achieve performance objectives tracked via specific indicators. The horizontal length of each bar reflects the interval during which a given, and sometimes competing, objective must be met. (b) The screen display associated with the MOHA report for a segment of the Okanagan River at Oliver. Flow regulation at Oliver is critical to meeting seasonal requirements for several life-history stages of sockeye adults, eggs, alevins and emergent fry (see text for details). Yellow triangles identify the position of the threshold above which river discharge will induce losses of sockeye eggs and alevins to flood-and-scour losses. Red squares indicate the position of the threshold below which river discharge will induce losses of eggs/alevins to drought and desiccation. Line and indicator bars follow the conventions described above. Dashed lines (black and blue) indicate observed and projected discharges, respectively, originating from unregulated tributaries downstream of the Okanagan Lake Dam. Unregulated tributary discharge may require 50–75% of flood-channel capacity during freshets and thus constrain major water releases from Penticton Dam for periods of several weeks.
![Figure 8. (a) Okanagan Lake segment of screen display presented to Fish and Water Management Tool (FWMT) users upon opening the multiple objective hazard assessment (MOHA) report. Water management performance indicators informing decisions for Okanagan Lake include: foreshore flood control, domestic water intake integrity, launching ramp and dock integrity, navigation ease and kokanee egg/alevin risk of desiccation. The solid black line identifies lake elevations to date. The solid blue line identifies simulated, lake-level outcomes associated with a proposed set of water releases. Green diamonds are preferred benchmarks for maintenance of seasonal water levels as defined by the Okanagan Basin Implementation Agreement (OBIA). The yellow triangle in late April is an alternate lake-level benchmark (as defined by the Okanagan Basin Agreement [OBA]) given certainty of high freshet and flood risk if late April snowpack is far above average. The yellow triangle in late October is the preferred lake elevation benchmark for fall spawning by kokanee on Okanagan Lake beaches. Green, amber and red segments of indicator bars follow low, moderate and high risk classifications of lake elevations associated with failure to achieve performance objectives tracked via specific indicators. The horizontal length of each bar reflects the interval during which a given, and sometimes competing, objective must be met. (b) The screen display associated with the MOHA report for a segment of the Okanagan River at Oliver. Flow regulation at Oliver is critical to meeting seasonal requirements for several life-history stages of sockeye adults, eggs, alevins and emergent fry (see text for details). Yellow triangles identify the position of the threshold above which river discharge will induce losses of sockeye eggs and alevins to flood-and-scour losses. Red squares indicate the position of the threshold below which river discharge will induce losses of eggs/alevins to drought and desiccation. Line and indicator bars follow the conventions described above. Dashed lines (black and blue) indicate observed and projected discharges, respectively, originating from unregulated tributaries downstream of the Okanagan Lake Dam. Unregulated tributary discharge may require 50–75% of flood-channel capacity during freshets and thus constrain major water releases from Penticton Dam for periods of several weeks.](/cms/asset/460276cb-60f5-46f4-8698-5503036d52a6/tcwr_a_985510_f0008_oc.gif)
Figure 9. Summary of hazard indicator reports derived from three Fish and Water Management Tool (FWMT) scenario simulations (FWMT-569, FWMT-561 and FWMT-568) executed in early August 2009 (Hyatt and Stockwell, unpublished observations). “Squeeze” under FWMT-568 refers to extreme reductions in the volume of water in Osoyoos Lake exhibiting temperature and oxygen values preferred by sockeye fry for rearing or by adults for pre-spawn holding.
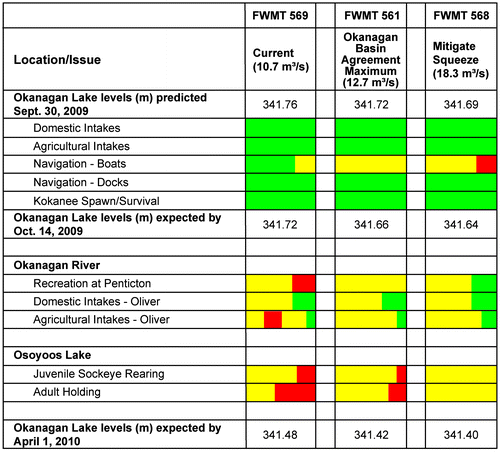
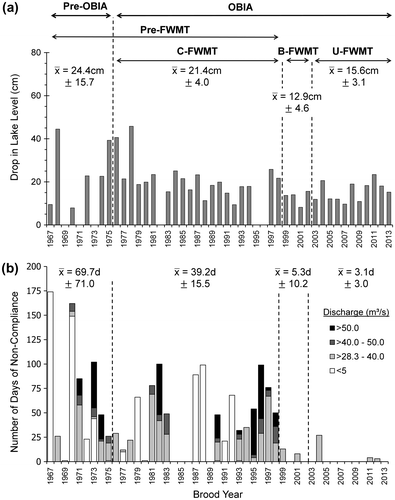
Figure 10. Summary observations from a before-and-after impact assessment of Fish and Water Management Tool (FWMT) deployment on compliance with fish friendly guidelines by fish and water managers during consecutive sets of years defined by: the absence of Okanagan Basin Implementation Agreement (OBIA) fisheries guidelines (pre-OBIA, 1967–1975), OBIA guidelines in force (1976–2013), where the latter then include pre-FWMT “control-years” (C-FWMT, 1976–1998), FWMT design-and-build years (B-FWMT, 1999–2002) and years of active FWMT use (U-FWMT, 2003–2013). Observations restricted to similar water supply years were used to test for differences between the means of lake level drawdowns, and the means or frequencies of non-compliant lake levels and river flows (see text for details). The years 1969, 1971, 1973, 1982, 1995 and 1996 were excluded from statistical comparisons because they exhibited subject interval hydrographs outside of the 190–750 million cubic meter seasonal range common to the remaining pre-FWMT and FWMT years. (a) Annual decline of Okanagan Lake level between 15 October and 28 February for each management interval defined above. (b) Number of days of non-compliant (NC) flows in the Okanagan River at Oliver. Non-compliance of observed discharge is classified according to the degree of departure from either an upper flood-and-scour threshold (begins at > 28.3 m3/s) or a drought-and-desiccation threshold (begins at < 5 m3s) for sockeye redds. All-year means (x) and 95% confidence intervals (CIs) of compliance indicators are shown for each management interval in (a) and (b).