811
Views
9
CrossRef citations to date
0
Altmetric
Research Papers

Risk factors associated with perceptions of drinking water quality in rural Saskatchewan

, &
Pages 36-46 | Received 13 Dec 2013, Accepted 09 Jul 2014, Published online: 13 Jan 2015

Figures & data

Figure 1. Causal diagram used to guide model development for each of the outcomes.

Figure 1. Causal diagram used to guide model development for each of the outcomes.

Table 1. Total numbers of complete and missing responses and the proportion of respondents at each level for each of the outcomes modeled and risk factors evaluated.

Table 2. Comparison of key demographic variables between the sample population and the Statistics Canada Citation2011 Census of Population for the rural census subdivisions included within the survey regions.

Table 3. Proportion of respondents identifying each type of aesthetic complaint overall and by the type of water source used.

Table 4. Risk factors significantly associated with having any type of aesthetic complaint with the household’s tap water in the final multivariable model.

Figure 2. Predicted probabilities of having any aesthetic complaint, comparing those who had a drinking water advisory to those who did not, for men and women in each age category averaged over the use of water delivered by truck and length of time residing in community. CI: confidence interval.
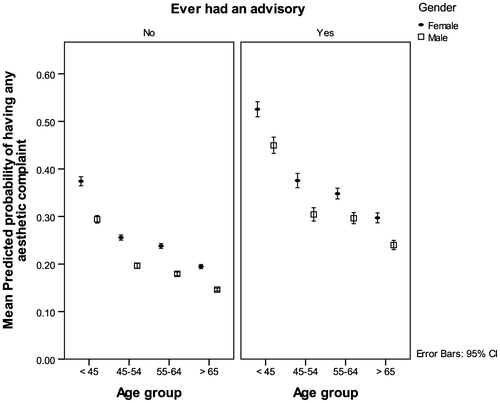
Figure 2. Predicted probabilities of having any aesthetic complaint, comparing those who had a drinking water advisory to those who did not, for men and women in each age category averaged over the use of water delivered by truck and length of time residing in community. CI: confidence interval.

Table 5. Risk factors significantly associated, in the final multivariable model, with the perception that household tap water is not safe to drink.

Figure 3. Predicted probabilities of believing the tap water is not safe to drink for the interaction between reporting a drinking water advisory and use of a ground water source, separated by whether or not an aesthetic complaint about the water was identified, and averaged over the use of a community water supply. CI: confidence interval.
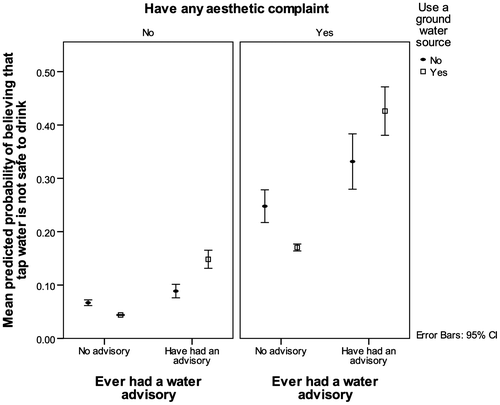
Figure 3. Predicted probabilities of believing the tap water is not safe to drink for the interaction between reporting a drinking water advisory and use of a ground water source, separated by whether or not an aesthetic complaint about the water was identified, and averaged over the use of a community water supply. CI: confidence interval.
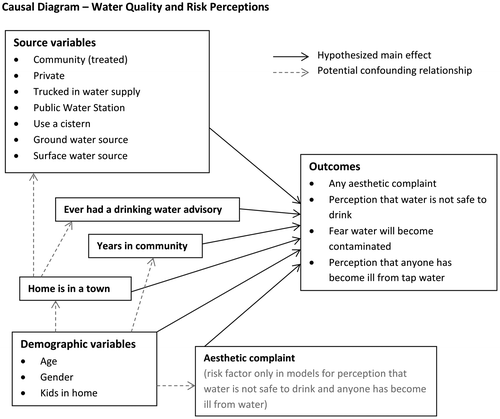
Table 6. Summary of the analyses for all water-quality or risk-perception outcomes, including the number of observations used and the risk factors associated with the final model for each outcome (effect modifications italicized).

Reprints and Corporate Permissions

Please note: Selecting permissions does not provide access to the full text of the article, please see our help page How do I view content?

To request a reprint or corporate permissions for this article, please click on the relevant link below:

Academic Permissions

Please note: Selecting permissions does not provide access to the full text of the article, please see our help page How do I view content?

Obtain permissions instantly via Rightslink by clicking on the button below:

If you are unable to obtain permissions via Rightslink, please complete and submit this Permissions form. For more information, please visit our Permissions help page.