906
Views
7
CrossRef citations to date
0
Altmetric
Research Papers

Climate and water availability indicators in Canada: Challenges and a way forward. Part III – Future scenarios

, &
Pages 160-172 | Received 30 Jan 2014, Accepted 08 Sep 2014, Published online: 28 Apr 2015

Figures & data

Table 1. List of climate models, and respective modeling centre and country.

Table 2. Drought indices and climate models chosen for projections of drought occurrence for climate change scenarios, listed by reference.

Table 3. Projected change in hydrologic indicators from basin-scale case studies, 2050s, compared with 1961–1990 or 1980–1999 baseline periods, median or range of median projections, unless otherwise indicated. Watersheds listed from western to eastern Canada. (Sources and models listed in Table .)

Figure 1. Projected changes in hydrologic indicators (from Table ). Adapted and updated from Bush et al. (Citation2014).
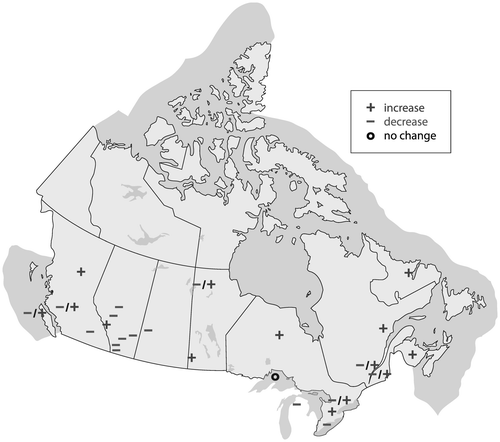
Figure 1. Projected changes in hydrologic indicators (from Table 3). Adapted and updated from Bush et al. (Citation2014).

Table 4. Hydrologic models and climate models chosen for projections of runoff for climate change scenarios (from Table ), listed by reference, in alphabetical order.

Reprints and Corporate Permissions

Please note: Selecting permissions does not provide access to the full text of the article, please see our help page How do I view content?

To request a reprint or corporate permissions for this article, please click on the relevant link below:

Academic Permissions

Please note: Selecting permissions does not provide access to the full text of the article, please see our help page How do I view content?

Obtain permissions instantly via Rightslink by clicking on the button below:

If you are unable to obtain permissions via Rightslink, please complete and submit this Permissions form. For more information, please visit our Permissions help page.