Figures & data
Figure 1. Points of interest and major hydrometric gauges along the Red River. (a) The region downstream of the City of Winnipeg; (b) the area within the city.
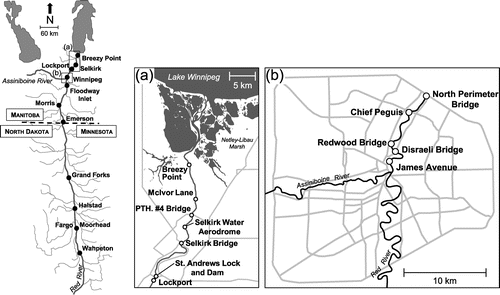
Figure 2. Cumulative degree days of melting at locations along the Red River from Moorhead, Minnesota, to Winnipeg, Manitoba. Data obtained from Environment Canada (Citation2014a) and National Oceanic and Atmospheric Administration (Citation2014).
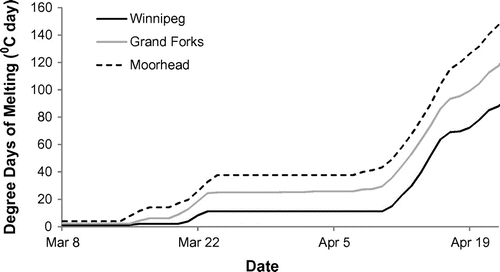
Table 1. Comparison of 2009 peak stages to historical records along the Red River.
Figure 3. Daily average water level measurements from Emerson to Breezy Point. Hollow and filled circles indicate gauges located upstream and downstream of the Red River Floodway inlet, respectively. Data obtained from Environment Canada (Citation2014b).
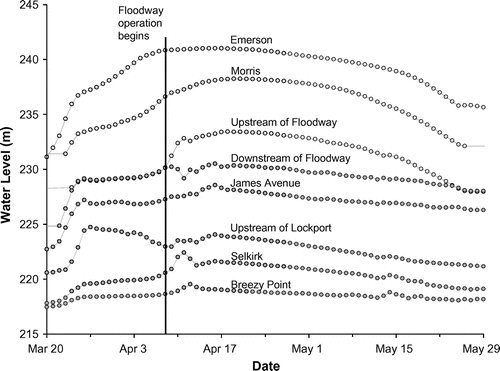
Figure 4. Peak flood land inundation near Fargo, North Dakota, and Moorhead, Minnesota, on 28 March 2009. Imagery was captured by the Advanced Land Imager on the National Aeronautics and Space Administration (NASA)’s EO-1 satellite (NASA Citation2009).
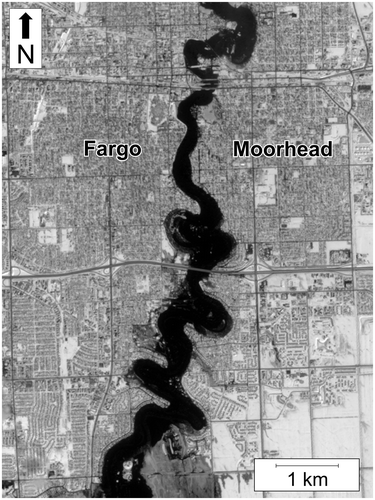
Figure 5. Land inundation in southern Manitoba based on RADARSAT imagery on 20 April 2009 (adapted from Canadian Space Agency Citation2009).
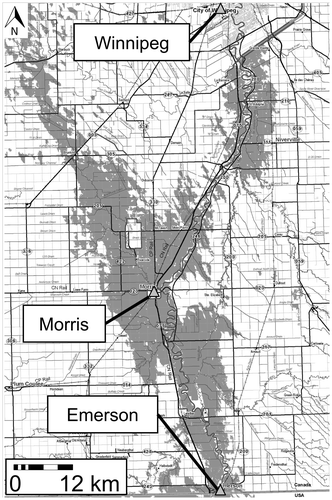
Figure 6. Floodway Inlet Control Structure (centre of image) with upstream ice cover on 9 April 2009, at 5 pm. View is looking south. Water flows over the inlet structure and through Winnipeg (bottom of image), or is diverted east around the city (left side of image). Photo courtesy of G. Mohr.
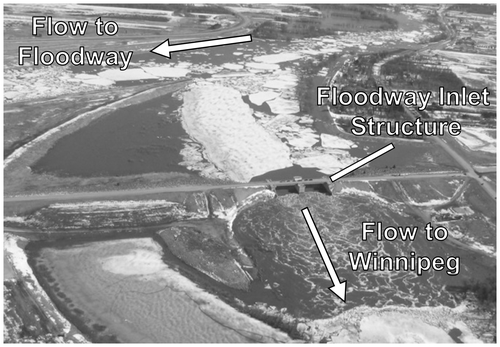
Figure 7. Water levels within the City of Winnipeg from 10–14 April 2009. Data from the City of Winnipeg and Water Survey of Canada.
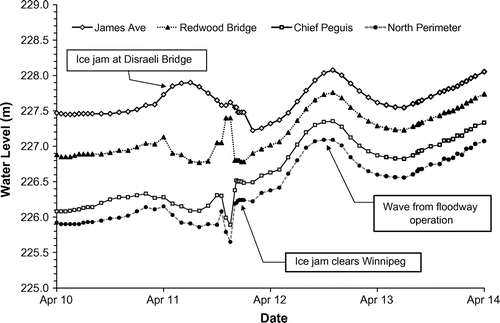
Figure 8. Ice jam on the Red River at Disraeli Bridge (center of image) on 11 April 2009 at 8:30 am. Flow from right to left. Photos by Taiga Air Services Ltd, courtesy of the Province of Manitoba.
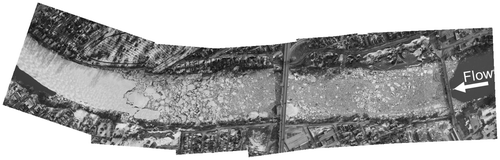
Figure 9. Manitoba flows at the time of flood crest at James Avenue (16 April 2009). Hydrometric data obtained from Environment Canada (Citation2014b).
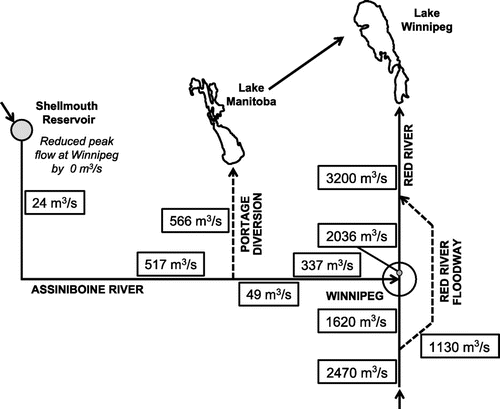
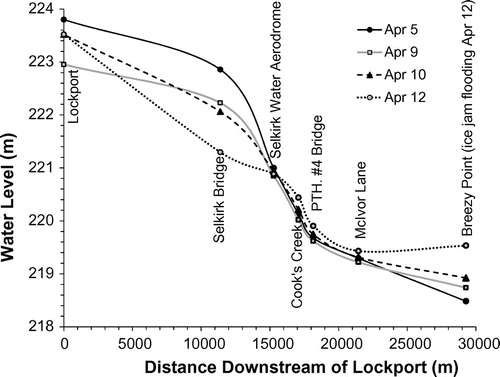
Figure 10. Water levels near Selkirk during April 2009 ice jamming.