789
Views
2
CrossRef citations to date
0
Altmetric
Articles

Challenging the standard dike freeboard: Methods to quantify statistical uncertainties in river flood protection

&
Pages 151-160 | Received 21 Jul 2014, Accepted 17 Jan 2015, Published online: 08 Apr 2015

Figures & data

Figure 1. Study area showing the upper Bow River watershed, and the rain gauge location on which the analysis in this paper is based.
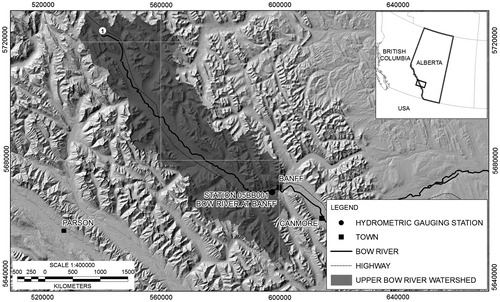
Figure 1. Study area showing the upper Bow River watershed, and the rain gauge location on which the analysis in this paper is based.

Figure 2. Plots for selection of thresholds above which the approximation by a generalized Pareto distribution is reasonable. Top panel shows the mean excess plot; bottom panel displays the parameter stability plots. The plots are computed for data restricted to the high-level period from May to August.
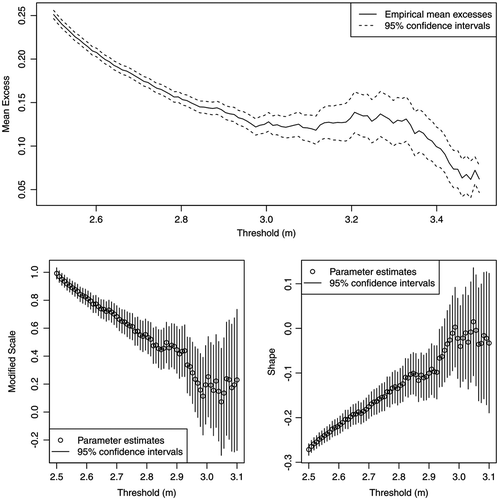
Figure 2. Plots for selection of thresholds above which the approximation by a generalized Pareto distribution is reasonable. Top panel shows the mean excess plot; bottom panel displays the parameter stability plots. The plots are computed for data restricted to the high-level period from May to August.

Figure 3. Cluster maxima in excess of 2.95-m threshold based on the interval de-clustering method and blocking by years.
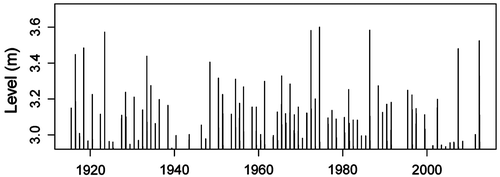
Figure 3. Cluster maxima in excess of 2.95-m threshold based on the interval de-clustering method and blocking by years.

Figure 4. Sensitivity of the 200-year return level estimate 200 and upper bounds of 95% confidence intervals computed using the delta method (DM), parametric bootstrap and profile likelihood (PL) to the length of data record. Estimation is repeated for expanding record length starting in year 1915 until 2012; the threshold is set to 2.95 m.
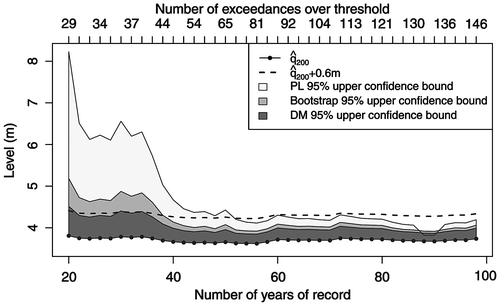
Figure 4. Sensitivity of the 200-year return level estimate 200 and upper bounds of 95% confidence intervals computed using the delta method (DM), parametric bootstrap and profile likelihood (PL) to the length of data record. Estimation is repeated for expanding record length starting in year 1915 until 2012; the threshold is set to 2.95 m.
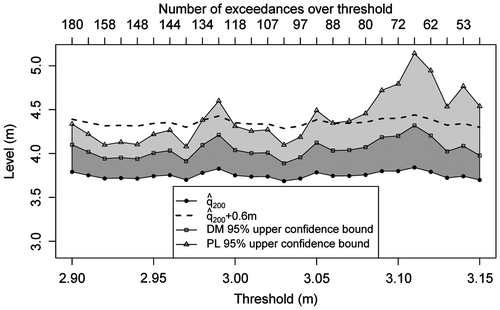
Figure 5. Sensitivity of the 200-year return level estimate 200 and upper bounds of 95% confidence intervals computed using the delta method (DM) and profile likelihood (PL) to threshold used for declustering and model estimation. The complete data record from 1915 to 2012 is used in estimation.

Figure 5. Sensitivity of the 200-year return level estimate 200 and upper bounds of 95% confidence intervals computed using the delta method (DM) and profile likelihood (PL) to threshold used for declustering and model estimation. The complete data record from 1915 to 2012 is used in estimation.

Reprints and Corporate Permissions

Please note: Selecting permissions does not provide access to the full text of the article, please see our help page How do I view content?

To request a reprint or corporate permissions for this article, please click on the relevant link below:

Academic Permissions

Please note: Selecting permissions does not provide access to the full text of the article, please see our help page How do I view content?

Obtain permissions instantly via Rightslink by clicking on the button below:

If you are unable to obtain permissions via Rightslink, please complete and submit this Permissions form. For more information, please visit our Permissions help page.