682
Views
5
CrossRef citations to date
0
Altmetric
Articles

Assessing the impact of climate change on the frequency of floods in the Red River basin

Pages 331-342 | Received 27 Aug 2014, Accepted 27 Feb 2015, Published online: 18 May 2015

Figures & data

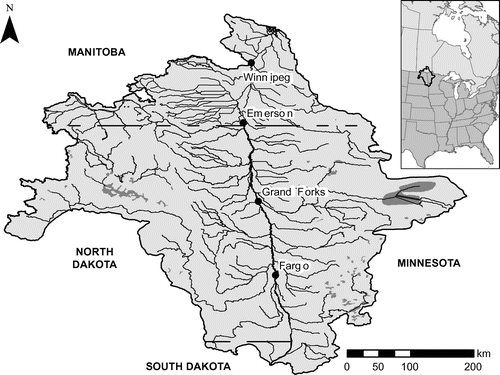
Figure 1. Red River basin.

Figure 1. Red River basin.

Figure 2. Spring peak discharge for the Red River at Emerson for the period 1913–2014. Years where the maximum annual flow did not occur in the spring are indicated with markers.
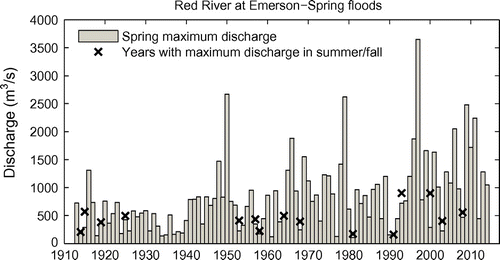
Figure 2. Spring peak discharge for the Red River at Emerson for the period 1913–2014. Years where the maximum annual flow did not occur in the spring are indicated with markers.

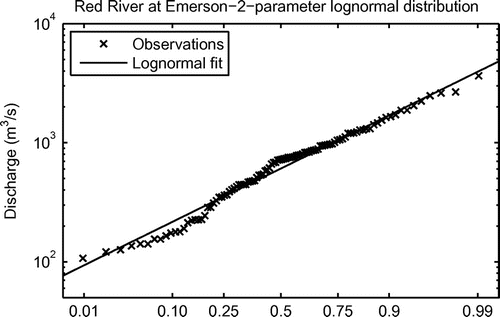
Figure 3. Two-parameter log-normal distribution fitted to spring peak flows at Emerson.

Figure 3. Two-parameter log-normal distribution fitted to spring peak flows at Emerson.

Table 1. Table of flood predictors used in the study.

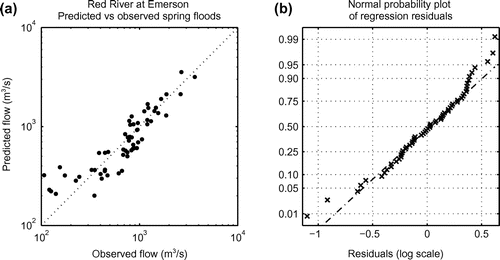
Figure 4. Performance of the flood prediction model in Equation (Equation3) for the period 1940–1999. (a) Predicted versus observed spring peak discharge at Emerson. (b) Normal probability plot of residuals from the regression model in Equation (Equation3).

Figure 4. Performance of the flood prediction model in Equation (Equation3(3) ) for the period 1940–1999. (a) Predicted versus observed spring peak discharge at Emerson. (b) Normal probability plot of residuals from the regression model in Equation (Equation3(3) ).

Table 2. Global climate models from the Coupled Model Intercomparison Project – Phase 5 (CMIP5) ensemble used in the study.

Figure 5. Delta values for annual precipitation and mean annual temperature in the Red River basin. For precipitation (P), delta values represent the ratio of the mean of future annual precipitation (average of the 30-year periods) to the mean of annual precipitation for the control simulation. For temperature (T), delta values represent differences between future mean annual temperature and control mean annual temperature. The points correspond to the 16 global climate models listed in Table . RCP = Representative Concentration Pathways.
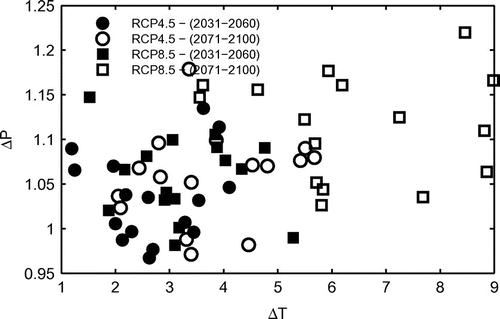
Figure 5. Delta values for annual precipitation and mean annual temperature in the Red River basin. For precipitation (P), delta values represent the ratio of the mean of future annual precipitation (average of the 30-year periods) to the mean of annual precipitation for the control simulation. For temperature (T), delta values represent differences between future mean annual temperature and control mean annual temperature. The points correspond to the 16 global climate models listed in Table 2. RCP = Representative Concentration Pathways.

Figure 6. Monthly ensemble means of control simulation and future simulations for (a) temperature, (b) precipitation and (c) evaporation. Each curve is obtained by averaging over the 16 global climate models in Table .
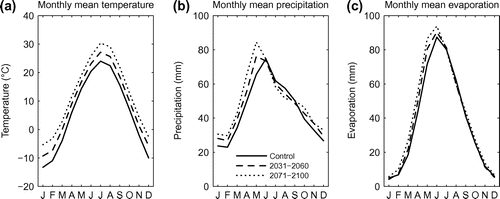
Figure 6. Monthly ensemble means of control simulation and future simulations for (a) temperature, (b) precipitation and (c) evaporation. Each curve is obtained by averaging over the 16 global climate models in Table 2.

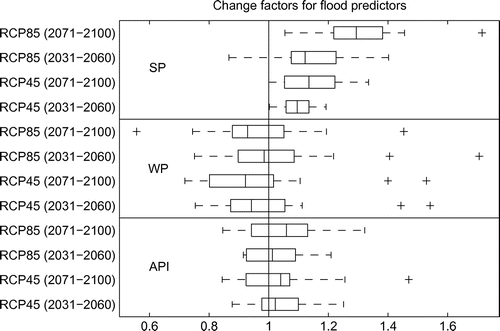
Figure 7. Change factors for flood predictors used in the regression model in Equation (Equation3). The box plots are based on the 16 global climate models in Table and are calculated using Equations (Equation10), (12) and (13). RCP = Representative Concentration Pathways.

Figure 7. Change factors for flood predictors used in the regression model in Equation (Equation3(3) ). The box plots are based on the 16 global climate models in Table 2 and are calculated using Equations (Equation1(1) 0), (12) and (13). RCP = Representative Concentration Pathways.

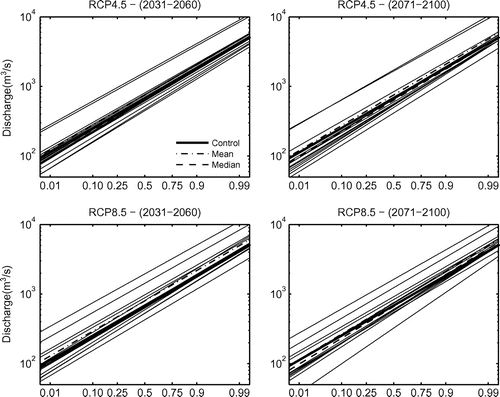
Figure 8. Projected changes in the distribution of floods for different emission scenarios and different time periods. Grey lines show the results from individual global climate models. RCP = Representative Concentration Pathways.

Figure 8. Projected changes in the distribution of floods for different emission scenarios and different time periods. Grey lines show the results from individual global climate models. RCP = Representative Concentration Pathways.

Reprints and Corporate Permissions

Please note: Selecting permissions does not provide access to the full text of the article, please see our help page How do I view content?

To request a reprint or corporate permissions for this article, please click on the relevant link below:

Academic Permissions

Please note: Selecting permissions does not provide access to the full text of the article, please see our help page How do I view content?

Obtain permissions instantly via Rightslink by clicking on the button below:

If you are unable to obtain permissions via Rightslink, please complete and submit this Permissions form. For more information, please visit our Permissions help page.