1,424
Views
23
CrossRef citations to date
0
Altmetric
Articles

Public relief and insurance for residential flood losses in Canada: Current status and commentary

, , &
Pages 220-237 | Received 02 Jul 2014, Accepted 09 Apr 2015, Published online: 16 Jun 2015

Figures & data

Table 1. Top five causes of hydrological and meteorological disaster events and proportion of total number of meteorological and hydrological disasters recorded in the Canadian Disaster Database, 1983–2013.

Table 2. Selection of flood disaster events exceeding CAD $40 million in damages, 1996 to present.

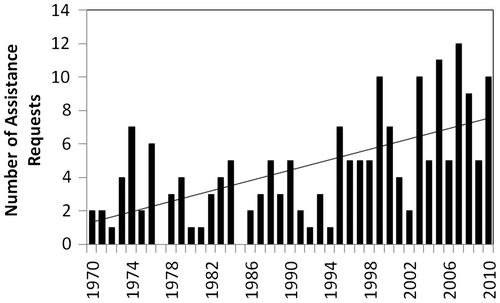
Figure 1. Number of requests for Disaster Financial Assistance Arrangements (DFAA) assistance from 1970 to 2010.
Source: Public Safety Canada (PSC Citation2011, 8).
Figure 1. Number of requests for Disaster Financial Assistance Arrangements (DFAA) assistance from 1970 to 2010.

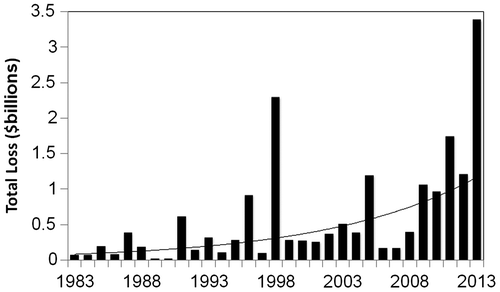
Figure 2. The Insurance Bureau of Canada (IBC) notes a steady increase in the costs of natural catastrophes for the Canadian insurance industry. Overall catastrophic losses recorded by the industry approached or exceeded CAD $1 billion* in 1998, 2005, 2009, 2010, 2011, 2012 and 2013, though IBC (Citation2014a) notes a change in data collection methods starting in 2009. At over $3 billion in losses, 2013 saw the greatest amount of natural catastrophe-related damages since the industry began recording figures in 1983. Much of the damage experienced in 2013 was associated with riverine and extreme rainfall related flooding in southern Alberta and southern Ontario.
Source: IBC (Citation2014a).
Figure 2. The Insurance Bureau of Canada (IBC) notes a steady increase in the costs of natural catastrophes for the Canadian insurance industry. Overall catastrophic losses recorded by the industry approached or exceeded CAD $1 billion* in 1998, 2005, 2009, 2010, 2011, 2012 and 2013, though IBC (Citation2014a) notes a change in data collection methods starting in 2009. At over $3 billion in losses, 2013 saw the greatest amount of natural catastrophe-related damages since the industry began recording figures in 1983. Much of the damage experienced in 2013 was associated with riverine and extreme rainfall related flooding in southern Alberta and southern Ontario.

Figure 3. A sample of water damage insurance claims in the western Greater Toronto Area filed on 8 or 9 July 2013. “Special” water damage claims typically include sewer backup losses but exclude other types of insured water damages, including plumbing and appliance failure. The claim sample is from a selection of property and casualty (P&C) insurers representing 17.5% of the Ontario personal property market. River flood hazard area delineations provided courtesy of Credit Valley Conservation and Toronto Region Conservation Authority.
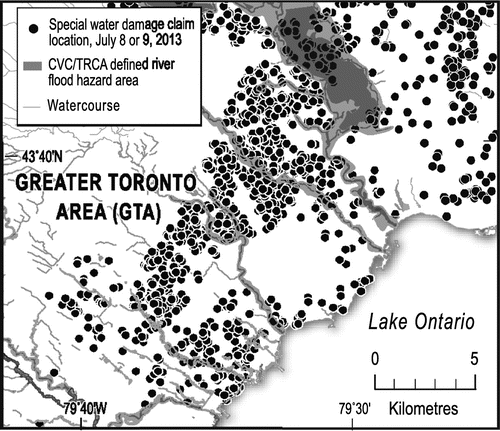
Figure 3. A sample of water damage insurance claims in the western Greater Toronto Area filed on 8 or 9 July 2013. “Special” water damage claims typically include sewer backup losses but exclude other types of insured water damages, including plumbing and appliance failure. The claim sample is from a selection of property and casualty (P&C) insurers representing 17.5% of the Ontario personal property market. River flood hazard area delineations provided courtesy of Credit Valley Conservation and Toronto Region Conservation Authority.

Table 3. Insured and uninsured flood types in Canada. This table is based on a summary of model wordings for homeowner insurance policies and endorsements produced by the Insurance Bureau of Canada (IBC). While the model wordings are largely optional outside of Quebec, they provide an indicator of the types of water damages that are currently insured by property and casualty (P&C) insurers in Canada.

Table 4. Five conditions that must typically be met for a peril to become insured. With respect to flood insurance, the conditions of mutuality, assessability, randomness and economic viability make the provision of flood insurance difficult.

Table 5. The Disaster Financial Assistance Arrangements (DFAA) financial assistance formula. The formula will be indexed to inflation beginning January 2016.

Table 6. Summary of key financial characteristics of provincial/territorial disaster financial assistance programs, individual and family components.

Reprints and Corporate Permissions

Please note: Selecting permissions does not provide access to the full text of the article, please see our help page How do I view content?

To request a reprint or corporate permissions for this article, please click on the relevant link below:

Academic Permissions

Please note: Selecting permissions does not provide access to the full text of the article, please see our help page How do I view content?

Obtain permissions instantly via Rightslink by clicking on the button below:

If you are unable to obtain permissions via Rightslink, please complete and submit this Permissions form. For more information, please visit our Permissions help page.