957
Views
24
CrossRef citations to date
0
Altmetric
Articles

Flooding in the Nechako River Basin of Canada: A random forest modeling approach to flood analysis in a regulated reservoir system

, &
Pages 250-260 | Received 02 May 2014, Accepted 14 Oct 2015, Published online: 21 Dec 2015

Figures & data

Figure 1. Map of the Nechako River Basin. All stations used in this analysis are presented in this figure. The red outline denotes the area upstream of the Kenney Dam and impacted by the Kemano project.
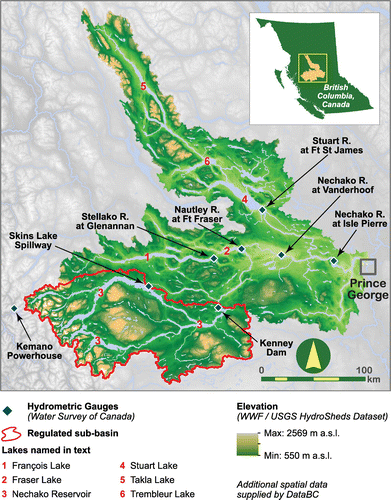
Figure 1. Map of the Nechako River Basin. All stations used in this analysis are presented in this figure. The red outline denotes the area upstream of the Kenney Dam and impacted by the Kemano project.

Table 1. Gauging stations metadata selected for analysis, and annual streamflow statistics (1955–2008). Coefficient of variation (CV) is computed as the ratio of the standard deviation (SD) to the mean.

Table 2. Dates of flooding in Prince George. Flooding dates based on Septer (Citation2007) and newspaper articles for post-2006 flood events.

Figure 2. The 1955–2008 hydrologic regimes of the seven selected gauging stations. The Stuart, Nautley and Stellako Rivers exhibit strongly nival regimes while the Nechako River hydrograph demonstrates the strong influence of upstream regulation. Both the Skins Lake Spillway and the Kemano Powerhouse irregular hydrographs are consistent with highly regulated flows.
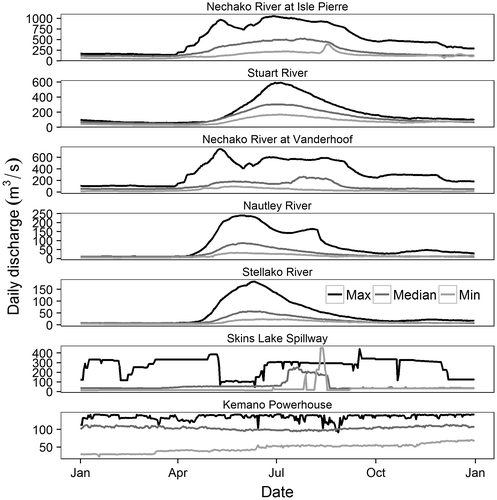
Figure 2. The 1955–2008 hydrologic regimes of the seven selected gauging stations. The Stuart, Nautley and Stellako Rivers exhibit strongly nival regimes while the Nechako River hydrograph demonstrates the strong influence of upstream regulation. Both the Skins Lake Spillway and the Kemano Powerhouse irregular hydrographs are consistent with highly regulated flows.

Figure 3. Relationship between discharge and total precipitation in the Nautley and Skins Lake Spillway respectively. Results of a Spearman’s rank correlation test are presented in the upper right hand corner of each panel.
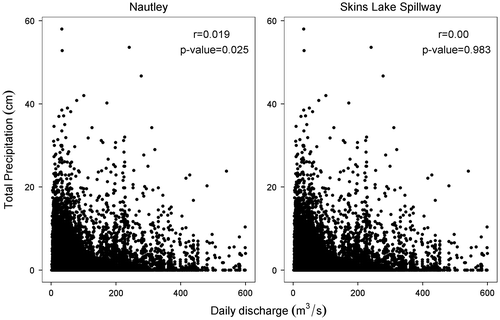
Figure 3. Relationship between discharge and total precipitation in the Nautley and Skins Lake Spillway respectively. Results of a Spearman’s rank correlation test are presented in the upper right hand corner of each panel.

Figure 4. Variable importance as estimated by a 5000 tree random forest. The model trained on this random forest included upstream discharge predictors of flooding in Prince George, BC. During spring floods the most important variables in the data models were the Stellako and Nautley Rivers. In contrast, the most important variables during winter floods were Skins Lake Spillway and Kemano Powerhouse discharge. In the absence of floods, the most important predictor was simply the main stem Nechako River discharge at Isle Pierre. Values should not be compared amongst panels but instead within panels. The absolute value on the vertical axis is only relevant as an intra-panel comparison.
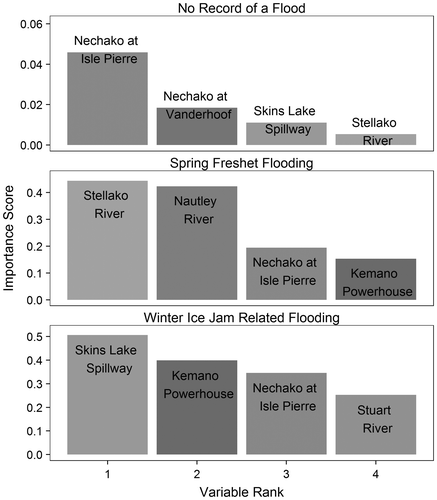
Figure 4. Variable importance as estimated by a 5000 tree random forest. The model trained on this random forest included upstream discharge predictors of flooding in Prince George, BC. During spring floods the most important variables in the data models were the Stellako and Nautley Rivers. In contrast, the most important variables during winter floods were Skins Lake Spillway and Kemano Powerhouse discharge. In the absence of floods, the most important predictor was simply the main stem Nechako River discharge at Isle Pierre. Values should not be compared amongst panels but instead within panels. The absolute value on the vertical axis is only relevant as an intra-panel comparison.

Figure 5. Correlation between a range of lagged (0–30 days) daily discharge values of individual gauges and the discharge of the Nechako River at Isle Pierre gauge over 1955–2008. Since the Stellako River is nested within the Nautley system, it was assumed that the lag time associated with the Nautley River was equivalent to the Stellako River and that the calculated lag time of the Stellako River (lag = 0) was a product of that nesting. Maximum values are labeled by the corresponding integer.
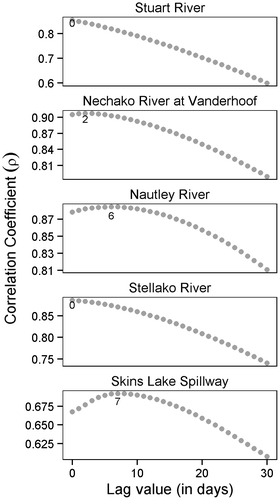
Figure 5. Correlation between a range of lagged (0–30 days) daily discharge values of individual gauges and the discharge of the Nechako River at Isle Pierre gauge over 1955–2008. Since the Stellako River is nested within the Nautley system, it was assumed that the lag time associated with the Nautley River was equivalent to the Stellako River and that the calculated lag time of the Stellako River (lag = 0) was a product of that nesting. Maximum values are labeled by the corresponding integer.

Figure 6. The contribution of the three major upstream watersheds to the Nechako River at Isle Pierre discharge. The figure highlights that most of the discharge in the basin is driven by the selected variables. Average individual drainage values for the Skins Lake Spillway, the Stuart River and the Nautley River are respectively 32.8, 50.5 and 11.3%. Values exceeding 100% are a single-year aberration and are likely due to instrument accuracy issues.
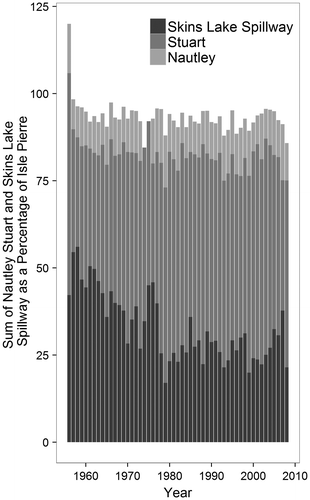
Figure 6. The contribution of the three major upstream watersheds to the Nechako River at Isle Pierre discharge. The figure highlights that most of the discharge in the basin is driven by the selected variables. Average individual drainage values for the Skins Lake Spillway, the Stuart River and the Nautley River are respectively 32.8, 50.5 and 11.3%. Values exceeding 100% are a single-year aberration and are likely due to instrument accuracy issues.

Figure 7. Multi-year discharge patterns (2005–2008) for four selected gauging stations within the Nechako River Basin.
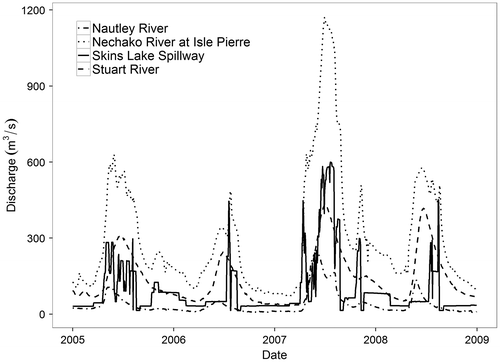
Figure 7. Multi-year discharge patterns (2005–2008) for four selected gauging stations within the Nechako River Basin.

Reprints and Corporate Permissions

Please note: Selecting permissions does not provide access to the full text of the article, please see our help page How do I view content?

To request a reprint or corporate permissions for this article, please click on the relevant link below:

Academic Permissions

Please note: Selecting permissions does not provide access to the full text of the article, please see our help page How do I view content?

Obtain permissions instantly via Rightslink by clicking on the button below:

If you are unable to obtain permissions via Rightslink, please complete and submit this Permissions form. For more information, please visit our Permissions help page.