Figures & data
Figure 1. (a) Location of Quebec, (b) the Îles-de-la-Madeleine and (c) the archipelago’s main island (Cap-aux-Meules). The study area (from le Chemin des Chalets to Gros-Cap) and Martinique Beach are shown. The dashed line corresponds to the cross section presented in Figure . The simplified geology was adapted from Brisebois (Citation1981) (data source ©Gouvernement du Québec).
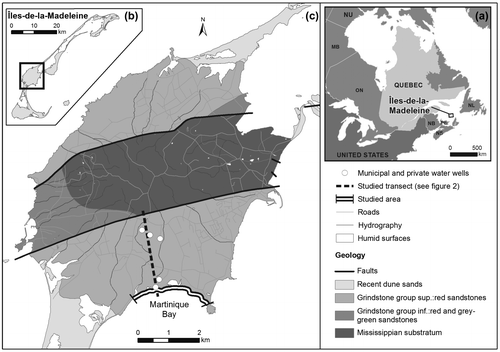
Figure 2. (a) Schematic cross section through the main geologic units of the main island (Cap-aux-Meules). The municipal (P4, P5, PU6) and private (PM) water wells are located along the geological transect. The position of the salt water/fresh water interface (shaded line) was estimated according to the Ghyben–Herzberg relation based on mean annual piezometric levels recorded in the municipal and private wells (corrected to mean sea level). (b) View of the sampling transect in Martinique Beach showing locations of piezometers (Pz1–3), multi-level samplers (M1–7), and seepage chamber deployments. The different morphology units of the beach also are reported.
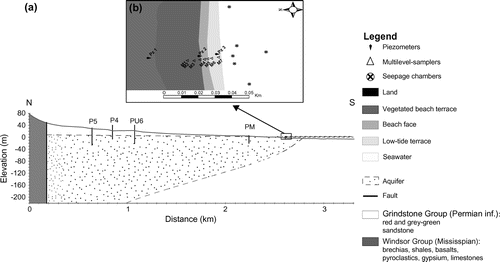
Table 1. Summary of hydrogeological values used to estimate groundwater fluxes and submarine groundwater discharges assuming a 1200-m sandy beach shoreline. K is the hydraulic conductivity (in m/d); gradh is the change in head per unit length in the direction of flow considering an isotropic aquifer. The groundwater fluxes are reported in term of q (in cm/d) and Q (in m3/s) based on Darcy’s law. Mean values and standard deviations (mean ± SD) are presented. Data from Madelin’Eau (Citation2004) were used to estimate groundwater fluxes in Permian aquifer, in inland water wells.
Figure 3. Conductivity (mS/cm; a, c), and dissolved oxygen saturation (%; b, d) in the beach groundwater. The left panels (a, b) present data measured in 2012 along a 35-m transect of multi-level samplers; the right panels (c, d) present data measured in 2013 in the intertidal zone (dashed rectangle in a and b panels). The beach morphology has been done by differential global positioning system (DGPS) measurements. The depth is relative to mean sea level (i.e., 0 m depth) and the contour lines were derived by linear spatial interpolation (kriging method) of the data. The interpolation model reproduced the empirical data set very well (95% confidence level). Data were modified from Chaillou et al. (Citation2014).
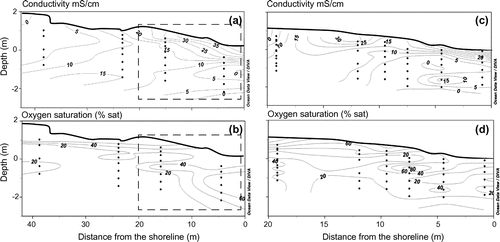
Figure 4. Mixing plot of beach groundwater dissolved organic carbon (DOC, a), dissolved inorganic carbon (DIC, b), and isotopic sigmature of dissolved inorganic carbon (δ13C-DIC, c) relative to beach groundwater conductivity for 2012 (dots) and 2013 (triangles). The value ranges for the two end-members (i.e., fresh groundwater and marine) and the theoretical dilution line (TDL; black line) are also reported. Concerning the isotopic signature of dissolved inorganic carbon (δ13C-DIC): because DIC concentrations of both end-members differ substantially, the conservative mixing between fresh groundwater and seawater is not linear. It follows a curvilinear mixing relationship based on the following equation:
where S is the sample salinity, is the DIC concentration and stable isotope composition of the freshwater end-member, and
is the DIC concentration and stable isotope composition for the marine end-member.
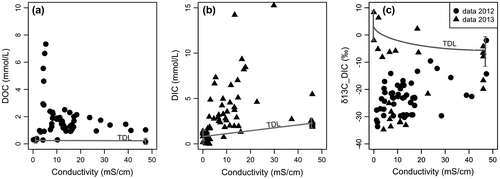
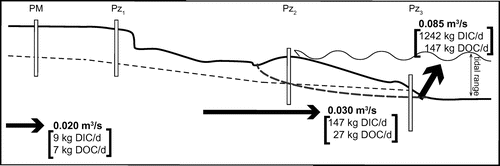
Figure 5. Schematic diagram of the hydrogeologic flow at the Martinique Beach site, indicating the potential end-member contribution to volumetric (in bold, unit: m3/s) SGD. Chemical fluxes of dissolved organic carbon (DOC) and dissolved inorganic carbon (DIC) are reported in kg/d. Diagram is not to scale. The tidal range is reported. The dashed line indicates the position of the fresh/saltwater lens. The dotted line is the position of the water table level. Weight of arrows is representative of relative flow strength.