Figures & data
Figure 1. (a) Québec Province map with location of the two study sites, (b) close-up map of the Matane River site (star), and (c) close-up view of the two wetlands (wetland A-WA and wetland B-WB) of the De la Roche River. The black square in (b) and (c) indicates the closest gauging station, and the darker grey area represents the watershed area.
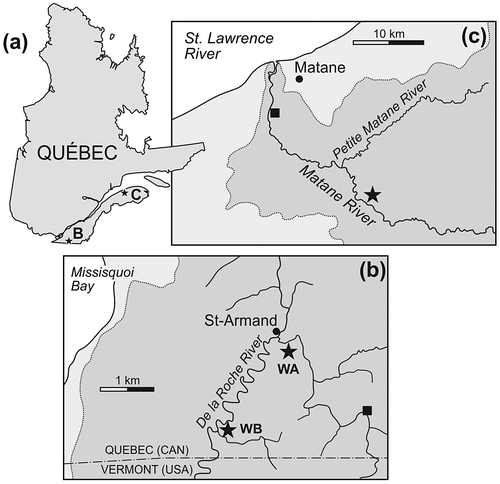
Table 1. Site hydrogeomorphological conditions on the De la Roche River for wetland A (DLR-WA) and wetland B (DLR-WB), and on the Matane River wetland.
Figure 2. Field site instrumentation: (a) wetland A of the De la Roche River (flow is from right to left), (b) wetland B of the De la Roche River (flow is from top to bottom) also showing the presence of a cold spot (localized groundwater contribution), and (c) wetland on the Matane River (flow is from bottom right to top left). Note the former meander loops which are visible in the LiDAR DEM in (c). The freedom space limits (defined in Biron et al. Citation2014) are indicated in each case with a solid black line.
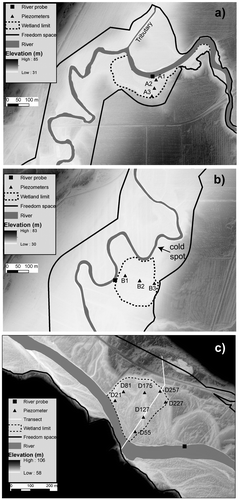
Figure 3. Piezometer transects showing water table elevation [meters above sea level (masl)], (a) for the De la Roche River with wetland A (DLR-WA), (b) for the De la Roche River with wetland B (DLR-WB) and (c) for the Matane River. The water levels are average values from the study periods on the two rivers.
![Figure 3. Piezometer transects showing water table elevation [meters above sea level (masl)], (a) for the De la Roche River with wetland A (DLR-WA), (b) for the De la Roche River with wetland B (DLR-WB) and (c) for the Matane River. The water levels are average values from the study periods on the two rivers.](/cms/asset/1896cf41-b55e-4c4d-8b69-79f51e3a070a/tcwr_a_1128360_f0003_b.gif)
Figure 4. Water level variations (a) for the De la Roche River with wetland A (WA), (b) for the De la Roche River with wetland B (WB) and (c) for the Matane River (modified from Cloutier et al. Citation2014). Water levels in the Matane River are higher than piezometer levels because the gauging station is located upstream from the piezometers. The arrows indicate the rain events illustrated in Figure .
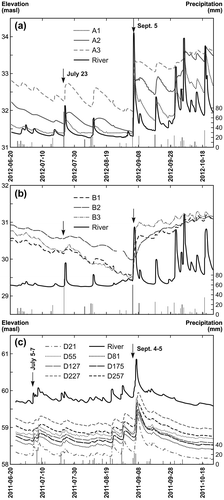
Figure 5. Changes in river and piezometer water levels [meters above sea level (masl)] for both wetlands in the De la Roche River (DLR) following rain events occurring on (a) 23 July 2012 (59 mm), and (b) 5 September 2012 (61 mm); changes in river and piezometer water levels in the Matane River following rain events occurring on (c) 5–7 July 2011 (34 mm), and (d) 4–5 September 2011 (58 mm).
![Figure 5. Changes in river and piezometer water levels [meters above sea level (masl)] for both wetlands in the De la Roche River (DLR) following rain events occurring on (a) 23 July 2012 (59 mm), and (b) 5 September 2012 (61 mm); changes in river and piezometer water levels in the Matane River following rain events occurring on (c) 5–7 July 2011 (34 mm), and (d) 4–5 September 2011 (58 mm).](/cms/asset/2d12efe5-1a30-42a5-93c7-cf1cae43880e/tcwr_a_1128360_f0005_b.gif)
Figure 6. Cross-correlation functions [rxy(k)] of river water levels as input and piezometer water levels as output (a) for the De la Roche River, and (b) for the Matane River.
![Figure 6. Cross-correlation functions [rxy(k)] of river water levels as input and piezometer water levels as output (a) for the De la Roche River, and (b) for the Matane River.](/cms/asset/168e3c12-d116-4c38-b8b3-8d29a5330736/tcwr_a_1128360_f0006_b.gif)
Figure 7. Water temperature (a) for the De la Roche River near wetlands A and B along with the temperatures in the piezometers of wetland A (wetland B piezometers show the same pattern), and (b) for the Matane River and the piezometers.
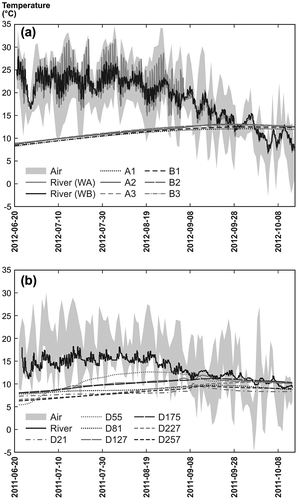
Figure 8. Cross-correlation functions of river water levels as input and piezometer water temperature as output (a) for the De la Roche River, and (b) for the Matane River.
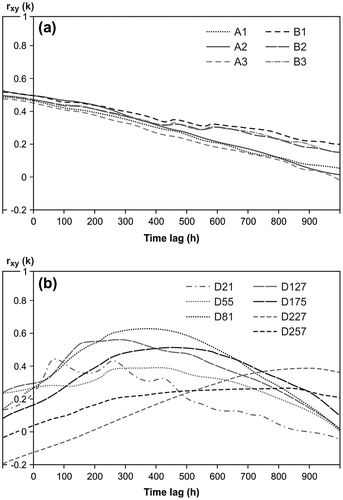
Figure 9. Autocorrelation functions of river and piezometer water levels (a) for the De la Roche River, and (b) for the Matane River.
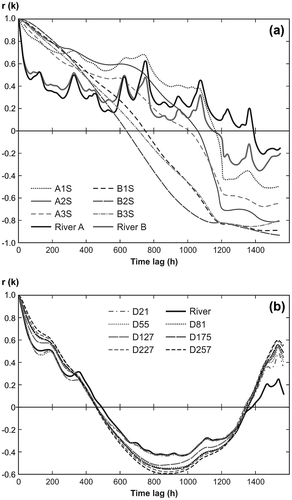
Table 2. Storage capacity on the De la Roche River for wetland A (DLR-WA), and on the Matane River wetland. The calculation is for the September rain events (2012 on the De la Roche River, and 2011 on the Matane River).
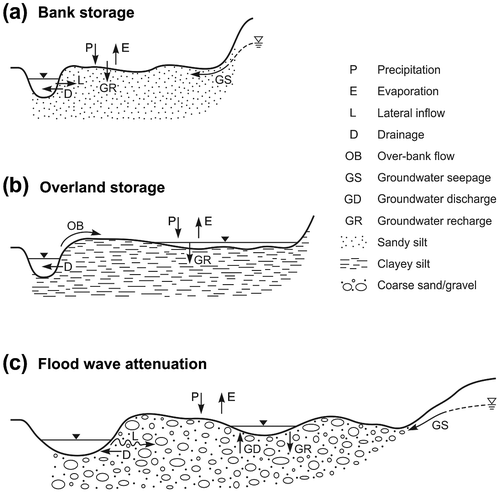
Figure 10. Typical river–wetland–aquifer connections with (a) bank storage, (b) overland storage and (c) flood wave attenuation (adapted from Ramsar Citation2005).