801
Views
11
CrossRef citations to date
0
Altmetric
Research Papers

Design floods for all of Canada

, &
Pages 398-411 | Received 27 Aug 2015, Accepted 11 Jan 2016, Published online: 26 Feb 2016

Figures & data

Figure 1. Flow chart of method.

Figure 1. Flow chart of method.

Figure 2. Comparison of median annual flood estimated from daily and instantaneous annual maximum flows.
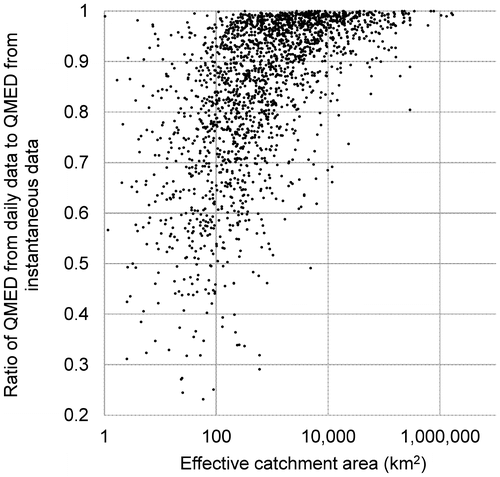
Figure 2. Comparison of median annual flood estimated from daily and instantaneous annual maximum flows.

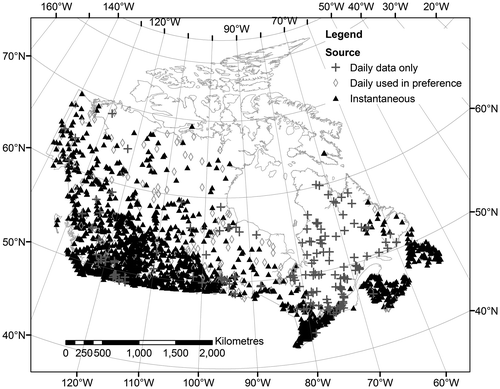
Figure 3. Gauging stations with at least 10 years of suitable flood peak data.

Figure 3. Gauging stations with at least 10 years of suitable flood peak data.

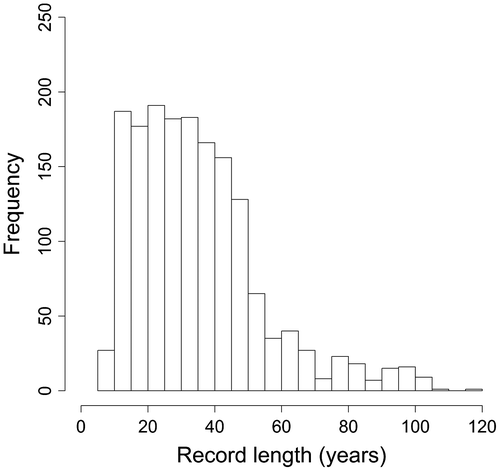
Figure 4. Histogram of record lengths.

Figure 4. Histogram of record lengths.

Figure 5. QMED plotted against gross catchment area, highlighting catchments with a large difference between effective and gross areas.
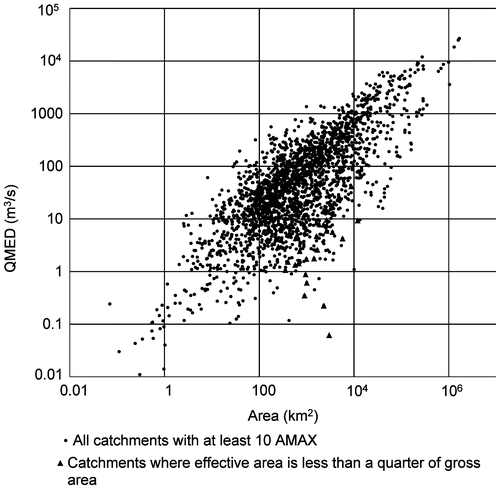
Figure 5. QMED plotted against gross catchment area, highlighting catchments with a large difference between effective and gross areas.

Figure 6. Residuals in the QMED regression equation plotted at the centroid of each gauged catchment.
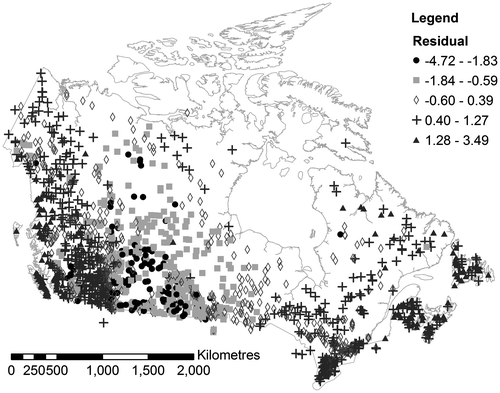
Figure 6. Residuals in the QMED regression equation plotted at the centroid of each gauged catchment.

Figure 7. L-moment ratios for all gauging stations in Canada with at least 20 years of flood peak data. Each circle represents a gauging station.
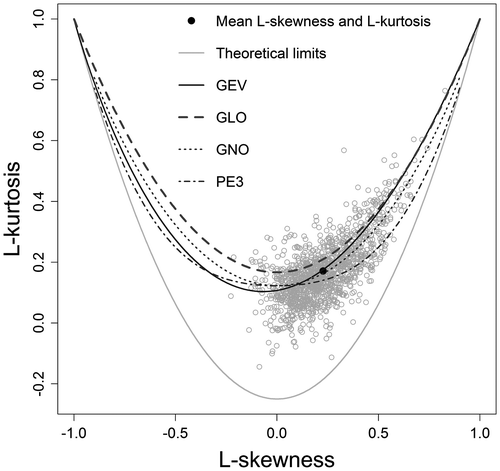
Figure 7. L-moment ratios for all gauging stations in Canada with at least 20 years of flood peak data. Each circle represents a gauging station.
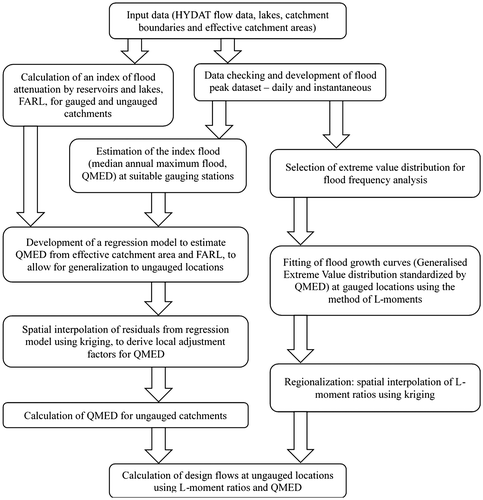
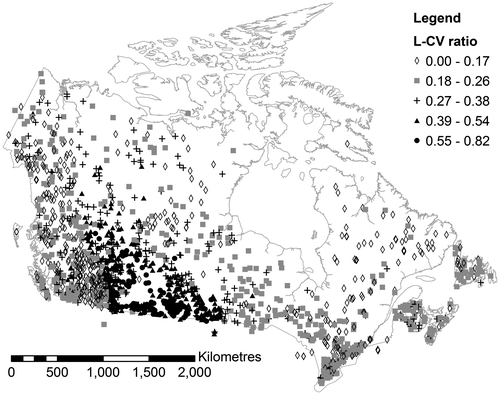
Figure 8. L-CV ratio plotted at the centroid of each gauged catchment.

Figure 8. L-CV ratio plotted at the centroid of each gauged catchment.

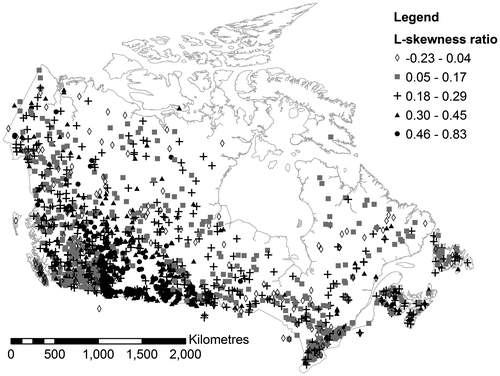
Figure 9. L-skewness ratio plotted at the centroid of each gauged catchment.

Figure 9. L-skewness ratio plotted at the centroid of each gauged catchment.

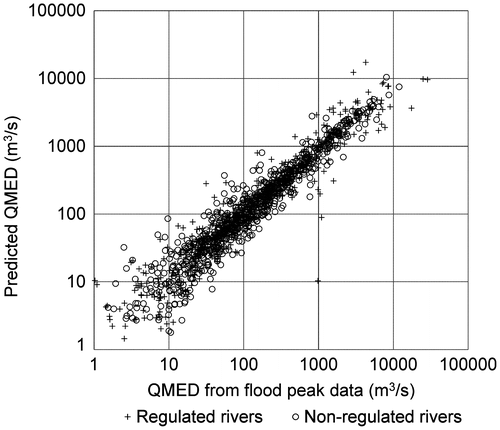
Figure 10. Cross-validation results for annual probability of 1 in 2.

Figure 10. Cross-validation results for annual probability of 1 in 2.

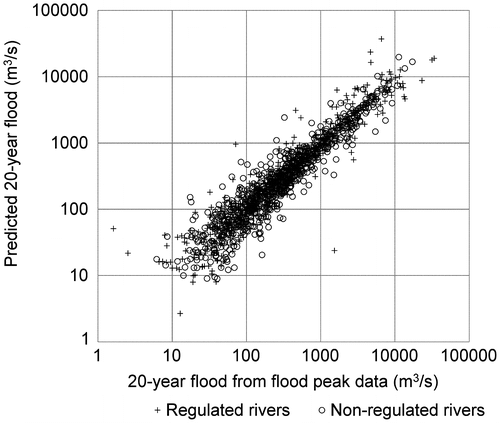
Figure 11. Cross-validation results for annual probability of 1 in 20.

Figure 11. Cross-validation results for annual probability of 1 in 20.

Table 1. Summary of cross-validation results for ungauged catchments.

Reprints and Corporate Permissions

Please note: Selecting permissions does not provide access to the full text of the article, please see our help page How do I view content?

To request a reprint or corporate permissions for this article, please click on the relevant link below:

Academic Permissions

Please note: Selecting permissions does not provide access to the full text of the article, please see our help page How do I view content?

Obtain permissions instantly via Rightslink by clicking on the button below:

If you are unable to obtain permissions via Rightslink, please complete and submit this Permissions form. For more information, please visit our Permissions help page.