Figures & data
Figure 1. Flow diagram illustrating the ideal separation of science and values in the steps leading to flow regulation (see text for detailed description).
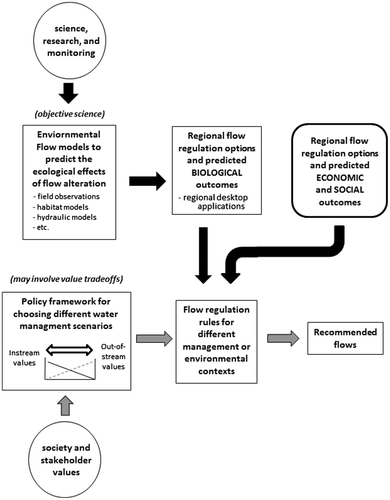
Figure 2. Habitat quality score (rating curve for generating biological performance metrics) as a function of mean annual discharge (MAD) for (a) the relationship used by Hatfield and Paul (Citation2015) assuming that habitat quality asymptotes at 20% MAD; (b) assuming habitat quality asymptotes at 30% MAD; (c) assuming a positive x-intercept, e.g. for species that require higher velocity habitats; and (d) assuming a non-linear biological response to flow.
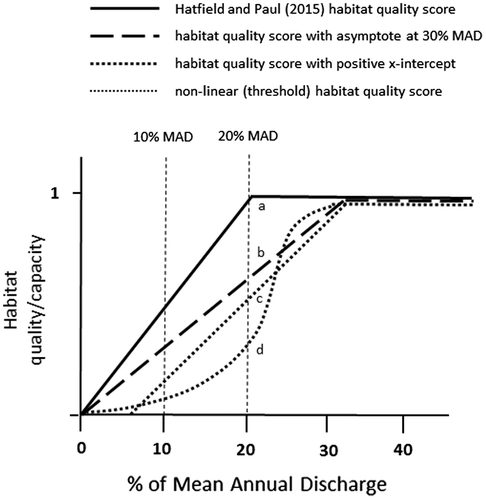
Figure 3. (a) Optimal flow (expressed as a percent of mean annual discharge [MAD] in m3·s−1) that maximizes modelled weighted useable area for juvenile salmonids in PHABSIM studies from western North America, plotted as a function of stream size indexed by mean annual discharge (MAD). Optimal flow = [2.71(−6.12+(0.679 ln(MAD*35.3))+(1.77 ln(49)))] · 35.3−1 · MAD−1. (b) Variable rating curves (inferred flow-ecology relationships) that result from higher optimal flows in smaller streams illustrated in (a), resulting in displacement of the threshold for decline in habitat capacity to higher flows in smaller channels. The solid black line represents the performance curve used by Hatfield and Paul (Citation2015). Note that lines are displaced slightly to minimize visual overlap.
![Figure 3. (a) Optimal flow (expressed as a percent of mean annual discharge [MAD] in m3·s−1) that maximizes modelled weighted useable area for juvenile salmonids in PHABSIM studies from western North America, plotted as a function of stream size indexed by mean annual discharge (MAD). Optimal flow = [2.71(−6.12+(0.679 ln(MAD*35.3))+(1.77 ln(49)))] · 35.3−1 · MAD−1. (b) Variable rating curves (inferred flow-ecology relationships) that result from higher optimal flows in smaller streams illustrated in (a), resulting in displacement of the threshold for decline in habitat capacity to higher flows in smaller channels. The solid black line represents the performance curve used by Hatfield and Paul (Citation2015). Note that lines are displaced slightly to minimize visual overlap.](/cms/asset/6c34b72e-789c-44f7-b6fc-f7a4f3e8559f/tcwr_a_1211036_f0003_b.gif)
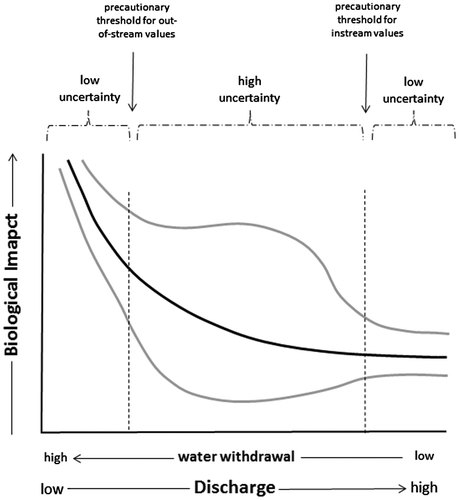
Figure 4. Hypothetical relationship between confidence in the degree of ecological impairment and flow alteration. In principle, the range of greatest uncertainty in the impacts of water withdrawal at low flows is at intermediate levels of water extraction (i.e. impacts of very small withdrawals are likely to be low with a high level of confidence; impacts of very large withdrawals at low flow are likely to be significant with a reasonable level of confidence).