623
Views
12
CrossRef citations to date
0
Altmetric
Articles

Modeling of subsurface agricultural drainage using two hydrological models with different conceptual approaches as well as dimensions and spatial scales

, &
Pages 38-53 | Received 22 Jul 2015, Accepted 29 Aug 2016, Published online: 04 Oct 2016

Figures & data

Figure 1. Location of tile-drained plot of interest in the Bras d’Henri micro-watershed (the star indicates the outlet).
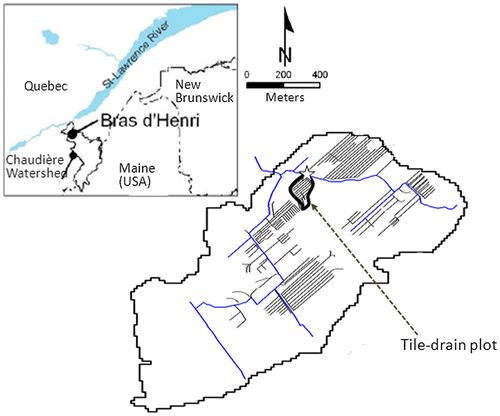
Figure 1. Location of tile-drained plot of interest in the Bras d’Henri micro-watershed (the star indicates the outlet).

Figure 2. Different scenarios of saturated hydraulic conductivity (KsXY) configurations for soil dynamics models assessment: (a) Scenario 1; (b) Scenario 2; (c) Scenario 3; (d) Scenario 4; (e) Scenario 5; (f) Scenario 6; (g) Scenario 7; and (h) Scenario 8.
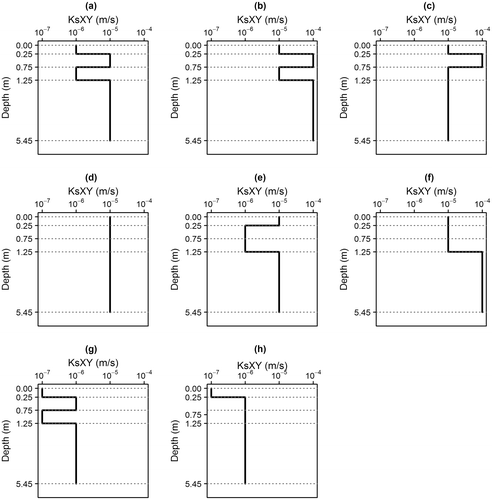
Figure 2. Different scenarios of saturated hydraulic conductivity (KsXY) configurations for soil dynamics models assessment: (a) Scenario 1; (b) Scenario 2; (c) Scenario 3; (d) Scenario 4; (e) Scenario 5; (f) Scenario 6; (g) Scenario 7; and (h) Scenario 8.
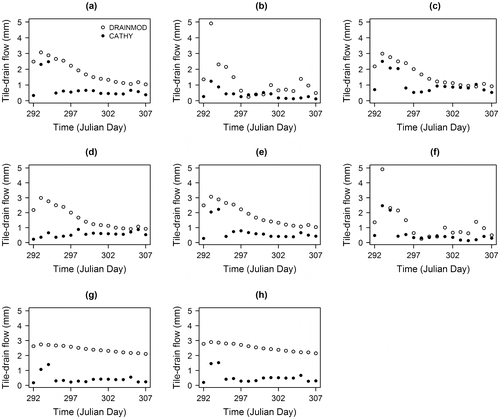
Table 1. CATHY soil hydraulic parameters in the porous media.

Table 2. DRAINMOD soil input values.

Table 3. List of drainage design input parameter values.

Table 4. Calibration and validation procedure periods.

Table 5. Model performance statistics.

Table 6. Model maximum and total predicted drain flows and their PEP and PEV values.

Figure 3. DRAINMOD and CATHY simulated tile-drain flow under soil dynamics models assessment using 2012 meteorological data: (a) Scenario 1; (b) Scenario 2; (c) Scenario 3; (d) Scenario 4; (e) Scenario 5; (f) Scenario 6; (g) Scenario 7; and (h) Scenario 8.

Figure 3. DRAINMOD and CATHY simulated tile-drain flow under soil dynamics models assessment using 2012 meteorological data: (a) Scenario 1; (b) Scenario 2; (c) Scenario 3; (d) Scenario 4; (e) Scenario 5; (f) Scenario 6; (g) Scenario 7; and (h) Scenario 8.

Figure 4. DRAINMOD and CATHY predicted and observed tile-drain flow comparison during calibration process: (a) summer 2011 and (b) fall 2011.
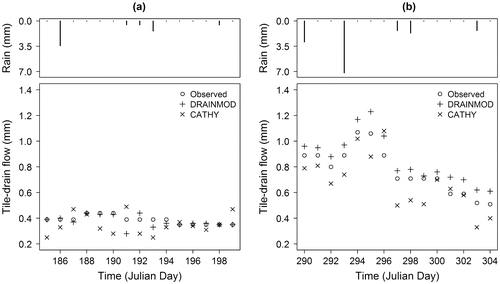
Figure 4. DRAINMOD and CATHY predicted and observed tile-drain flow comparison during calibration process: (a) summer 2011 and (b) fall 2011.

Table 7. Statistical comparison between simulated and observed tile-drain flow for the calibration periods. (TPDF: total predicted drain flow, TODF: total observed drain flow, R²: coefficient of determination, NSE: coefficient of efficiency (Nash), NSEm: modified coefficient of efficiency).

Figure 5. DRAINMOD and CATHY predicted and observed tile-drain flow comparison during validation process: (a) fall 2010; and (b) fall 2012.
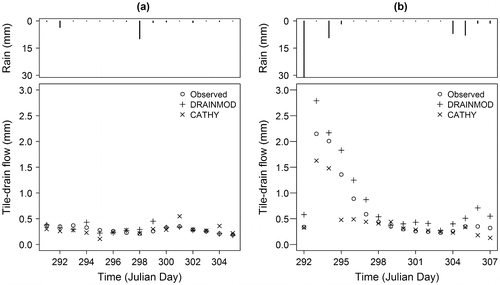
Figure 5. DRAINMOD and CATHY predicted and observed tile-drain flow comparison during validation process: (a) fall 2010; and (b) fall 2012.

Table 8. Statistical comparison between simulated and observed tile-drain flow for the validation periods. (TPDF: total predicted drain flow, TODF: total observed drain flow, R²: coefficient of determination, NSE: coefficient of efficiency (Nash), NSEm: modified coefficient of efficiency).

Figure 6. DRAINMOD and CATHY predicted tile-drain flows and the uncertainty range (in gray) with an error of ± 20% on observed tile-drain flows: (a) summer 2011; (b) fall 2011; (c) fall 2010; and (d) fall 2012.
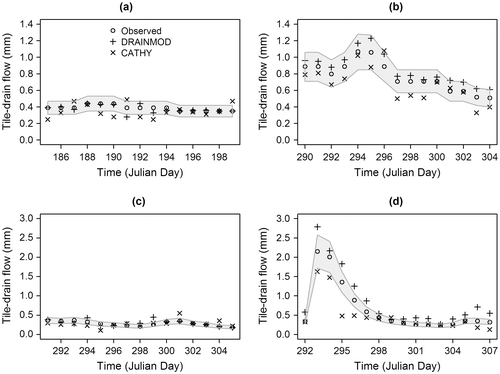
Figure 6. DRAINMOD and CATHY predicted tile-drain flows and the uncertainty range (in gray) with an error of ± 20% on observed tile-drain flows: (a) summer 2011; (b) fall 2011; (c) fall 2010; and (d) fall 2012.

Figure 7. Cumulative PET and cumulative AET simulated by DRAINMOD and CATHY: (a) summer 2011; (b) fall 2011; (c) fall 2010; and (d) fall 2012. (PET: Potential Evapotranspiration, AET: Actual Evapotranspiration).
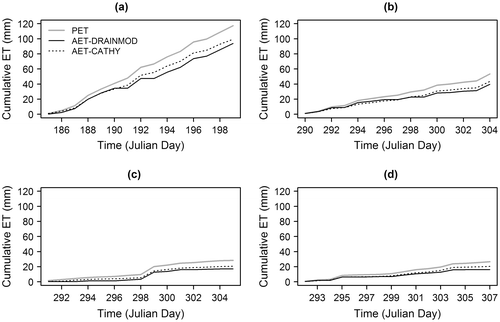
Figure 7. Cumulative PET and cumulative AET simulated by DRAINMOD and CATHY: (a) summer 2011; (b) fall 2011; (c) fall 2010; and (d) fall 2012. (PET: Potential Evapotranspiration, AET: Actual Evapotranspiration).

Table 9. Model performance in simulating actual evapotranspiration.

Figure 8. Impact of lateral saturated hydraulic conductivity (KsXY) change in each layer (variation of value of layer 1 (L1), 2 (L2), 3 (L3), 4 (L4)) of the porous media one at a time with respect to the cumulative tile-drain flow: (a) 1/10 KsXY – DRAINMOD; (b) 10 KsXY – DRAINMOD; (c) 1/10 KsXY – CATHY; and (d) 10 KsXY – CATHY.
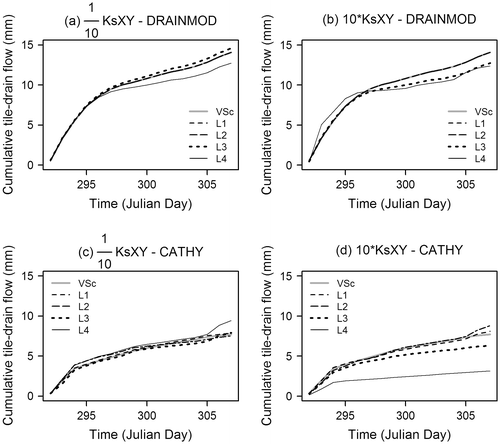
Figure 8. Impact of lateral saturated hydraulic conductivity (KsXY) change in each layer (variation of value of layer 1 (L1), 2 (L2), 3 (L3), 4 (L4)) of the porous media one at a time with respect to the cumulative tile-drain flow: (a) 1/10 KsXY – DRAINMOD; (b) 10 KsXY – DRAINMOD; (c) 1/10 KsXY – CATHY; and (d) 10 KsXY – CATHY.

Reprints and Corporate Permissions

Please note: Selecting permissions does not provide access to the full text of the article, please see our help page How do I view content?

To request a reprint or corporate permissions for this article, please click on the relevant link below:

Academic Permissions

Please note: Selecting permissions does not provide access to the full text of the article, please see our help page How do I view content?

Obtain permissions instantly via Rightslink by clicking on the button below:

If you are unable to obtain permissions via Rightslink, please complete and submit this Permissions form. For more information, please visit our Permissions help page.