251
Views
0
CrossRef citations to date
0
Altmetric
Articles

Influence of riparian grazing on channel morphology and riparian health of the Lower Little Bow River

, , &
Pages 18-32 | Received 10 Jul 2017, Accepted 27 Oct 2017, Published online: 16 May 2018

Figures & data

Table 1. Hypotheses for influence of reduced or no riparian grazing impact on channel morphology properties.

Figure 1. Monthly precipitation (a) and discharge at the mouth (b) in the Lower Little Bow River for May to October of 2009 to 2015 in relation to long-term mean (LTM) precipitation (49-y, 1961–2010) and discharge (42-y, 1973–2015).
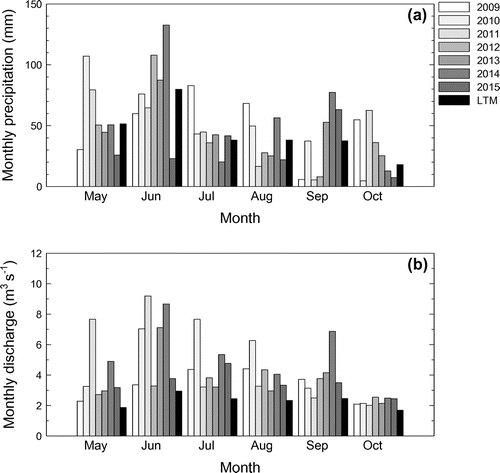
Figure 1. Monthly precipitation (a) and discharge at the mouth (b) in the Lower Little Bow River for May to October of 2009 to 2015 in relation to long-term mean (LTM) precipitation (49-y, 1961–2010) and discharge (42-y, 1973–2015).

Table 2. Influence of riparian grazing management on selected river morphology properties during a 3-yr study (2013–2015). Measurements conducted on the fenced reach in 2013 and 2014 were done after 12 and 13 yr of total cattle exclusion, respectively. Measurements in 2015 were done after 11 yr of cattle exclusion followed by 2 yr of periodic grazing.

Figure 2. Mean depth to riverbed with increasing distance from south bank across years for the fenced reach, unfenced reach with low-cattle impact on riparian pasture (UNF-L), and unfenced reach with high-cattle on riparian pasture (UNF-H). The standard error bars are not shown, for clarity.
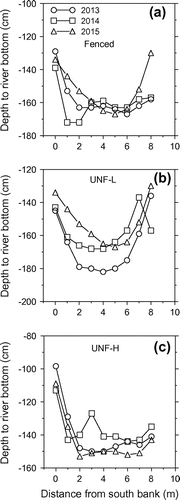
Figure 2. Mean depth to riverbed with increasing distance from south bank across years for the fenced reach, unfenced reach with low-cattle impact on riparian pasture (UNF-L), and unfenced reach with high-cattle on riparian pasture (UNF-H). The standard error bars are not shown, for clarity.

Table 3. Influence of riparian grazing treatment on streambank erosion rates for the Lower Little Bow River over 6 years (2009–2014).

Figure 3. Influence of grazing on mean-weight diameter (MWD) of riverbed sediment in 2013, 2014 and 2015. The three grazing treatments are fenced reach, unfenced reach with low-cattle impact on riparian pasture (UNF-L), and unfenced reach with high-cattle impact on riparian pasture. Vertical bars are means plus 1 standard error. Means within each year followed by different lower case letter are significantly (P ≤ 0.10) different.
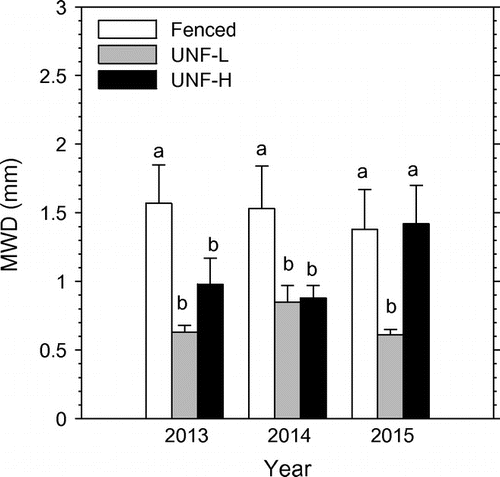
Figure 3. Influence of grazing on mean-weight diameter (MWD) of riverbed sediment in 2013, 2014 and 2015. The three grazing treatments are fenced reach, unfenced reach with low-cattle impact on riparian pasture (UNF-L), and unfenced reach with high-cattle impact on riparian pasture. Vertical bars are means plus 1 standard error. Means within each year followed by different lower case letter are significantly (P ≤ 0.10) different.

Table 4. Riparian health inventory of the fenced reach of the Lower Little Bow River prior to fencing being installed in 2001 and then 4, 8, 11 and 14 years after fencing was installed. The assessments in 2005, 2009 and 2012 were conducted after total cattle exclusion from riparian pasture. The assessment in 2015 was conducted after 11 yr (2001–2012) of total cattle exclusion followed by 2 yr (2013–2014) of periodic grazing of the riparian pasture.

Reprints and Corporate Permissions

Please note: Selecting permissions does not provide access to the full text of the article, please see our help page How do I view content?

To request a reprint or corporate permissions for this article, please click on the relevant link below:

Academic Permissions

Please note: Selecting permissions does not provide access to the full text of the article, please see our help page How do I view content?

Obtain permissions instantly via Rightslink by clicking on the button below:

If you are unable to obtain permissions via Rightslink, please complete and submit this Permissions form. For more information, please visit our Permissions help page.