Figures & data
Figure 1. Location of the Saguenay-Lac-Saint-Jean region and its principal physiographic features. The delineation of the study area is based on municipal boundaries.
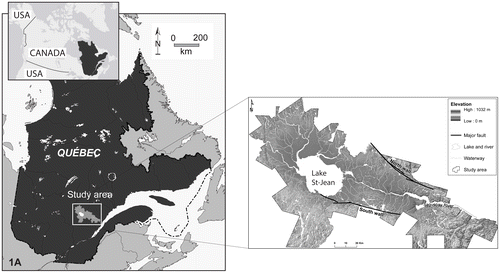
Figure 2. Schematic block diagram of aquifer types identified in the Saguenay-Lac-Saint-Jean region (CERM-PACES Citation2013).
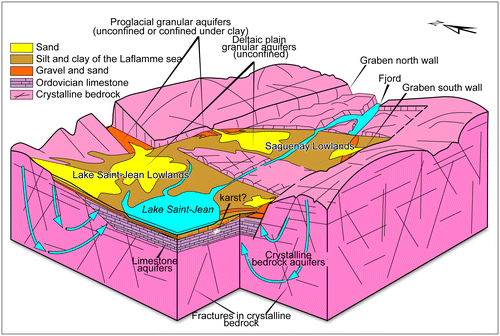
Figure 3. Bedrock geology of the Saguenay-Lac-Saint-Jean region, showing important structural features (brittle and ductile main structures), as the major faults delimiting the graben and the local uplands within the graben.
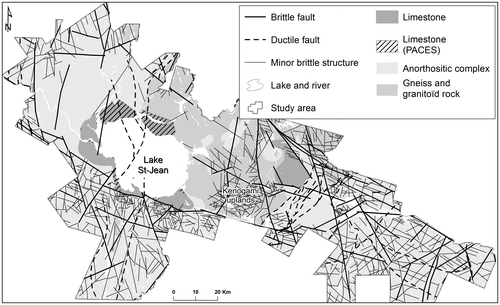
Figure 4. Compiled and calculated transmissivity in the fractured rock aquifers (adapted from CERM-PACES Citation2013).
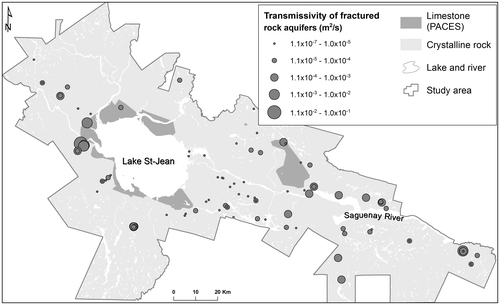
Figure 5. (a) Position of the 134 cross sections developed by interpreting local stratigraphic logs from boreholes and soundings. (b) An example of cross section: (A) cross section location; (B) cross-section interpretation (Modified from Chesnaux et al. Citation2017).
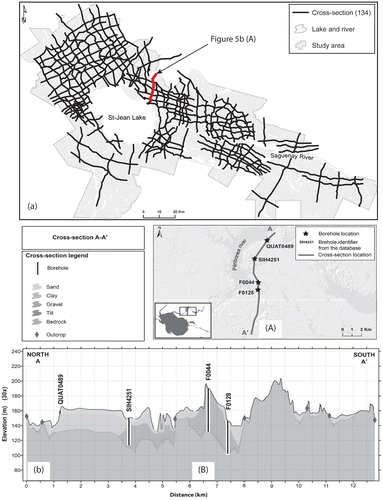
Figure 6. Compiled and calculated transmissivity in the granular aquifers (adapted from CERM-PACES Citation2013). Main granular aquifers in the Saguenay-Lac-Saint-Jean region, forming either free-surface aquifers, shown in yellow and orange, or confined aquifers, indicated by hatching.
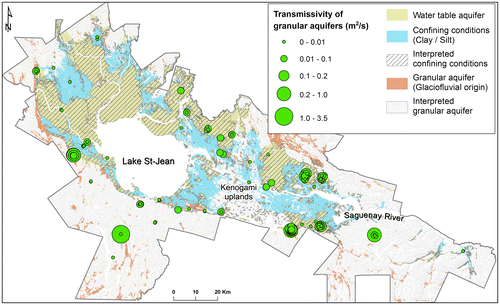
Figure 7. Generalized cross section showing the different salinization pathways occurring in the Saguenay-Lac-Saint-Jean region. Bedrock groundwater evolves from Ca,Na-HCO3 in unconfined environments to Ca,Na-Cl in rock-dominated environments due to interactions with basement fluids (water-rock interactions) along the graben fault system (groundwater flow line). The groundwater in the granular aquifers evolves from the recharge groundwater (Ca-HCO3) by Ca2+water-Na+mineral ion exchange process in a confined environment (Na-HCO3) and through possible mixing with the Laflamme seawater end-member (Na-Cl). This latter evolution might also be observed in bedrock aquifers where confining conditions prevail (Modified from Walter et al. Citation2017).
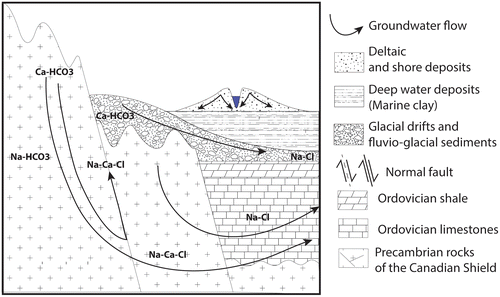
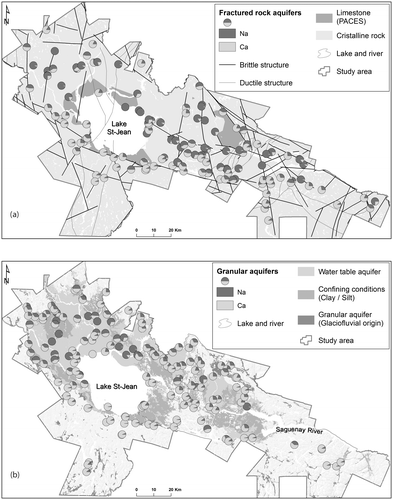
Figure 8. Relative proportion of the major cations (calcium and sodium) in the collected groundwater in (a) the bedrock aquifers, and (b) the granular aquifers.