Figures & data
Table 1. Expert estimates of inter-institutional relative power
Table 2. Expert estimates of member state relative power
Figure 1. Evolution with one-point crossover.
Table 3. Prediction errors using formal and estimated power scores
Figure 2. Estimated power and frequency of missing positions, by procedure.
Each panel plots power estimates from the experts range models in againt the number of missing positions for each actor in the DEU data.
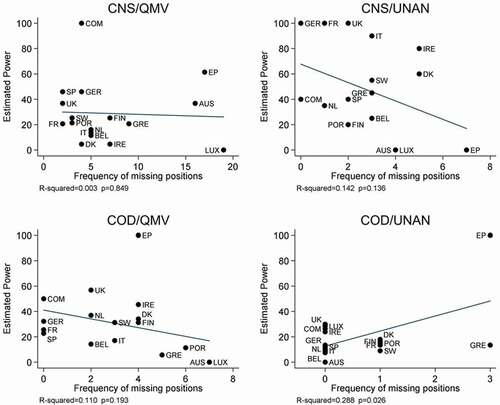
Figure 3. Estimated power and extremity (average distance), by produre.
Each panels plots power estimates from the experts range models in against each actor’s average absolute distance from the mean positions in the DEU data.
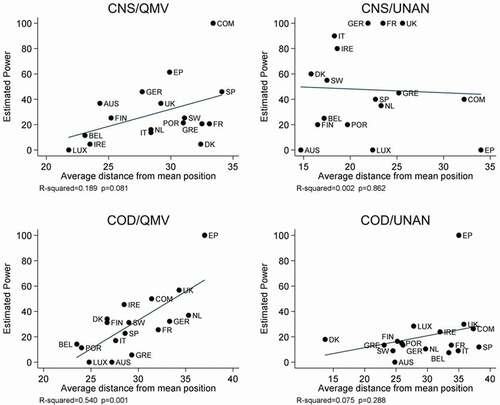
Figure 4. Estimated power and extremity (min or maxpositions), byprocedure.
Each panels plots power estimates from the experts range models in against the percentage of times each actor took a position at the minimum or maximum of the polocy alternatives in the DEU data.
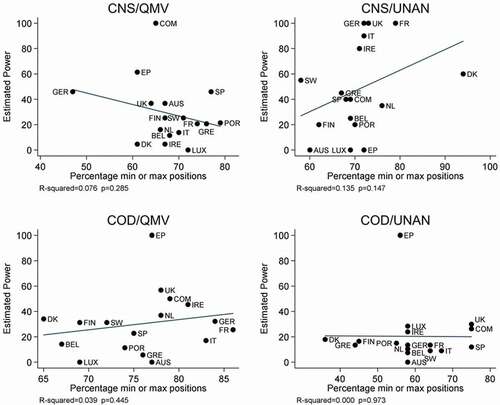
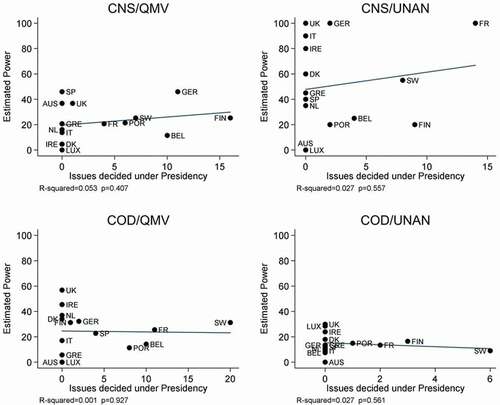
Figure 5. Estimated power and council presidency, byprocedure.
Each panel plots power estimates from the experts range models in against the number of issues in the DEU data decided under each Member State’s Council Presidency.