
Figures & data
Figure 1. CPI in EU response to energy security crises – resource substitution.
Sources: Eurostat (Citation2022); European Commission (Citation2011c),Citation2018b,Citation2021b,Citation2022e; own calculations (see supplementary material, Tables SM1,2,3). Notes: the figure shows the extent of the (mis)alignment of RES share of gross final energy consumption (%) with a strong CPI trajectory in 2030 (see supplementary material, Tables SM1,2,3).
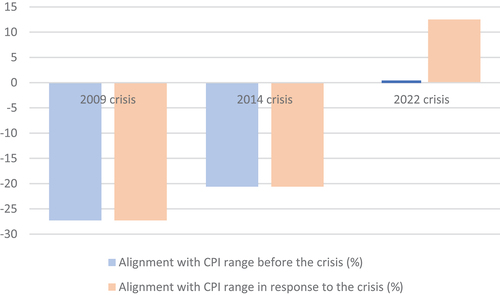
Figure 2. CPI in EU response to energy security crises – demand reduction.
Sources: See (see supplementary material, Tables SM4,5,6). Notes: the figure shows the extent of the (mis)alignment of final energy consumption (Mtoe) with a strong CPI trajectory in 2030 (see supplementary material, Tables SM4,5,6).
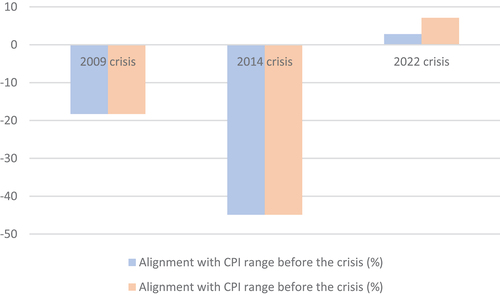
Figure 3. CPI in EU response to energy security crises – gas diversification.
Sources: See ; ENTSOG (Citation2022); Regulations (EU): 1391/2013;2016/89;2022/534; Own calculations (see supplementary material, Tables SM7,8,9,10). Notes: the figure shows the extent of the (mis)alignment of gas import capacity (Mtoe) with a strong CPI trajectory in 2030, identified as an ideal capacity by adding a 30% capacity buffer to gas demand trajectories compatible with long-term climate objectives (see supplementary material, Tables SM7,8,9,10).
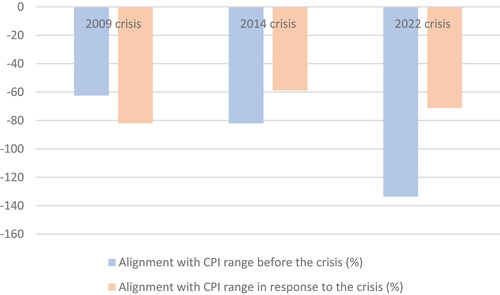
Table 1. Presence of explanatory conditions: sources: own assessment based on analysis in the text.
Supplemental material