
Figures & data
Figure 1. Map of the study area in south-western Sweden. The Remningstorp forest estate covers 1,500 hectares of managed forest. A regular grid with 10 m radius sample plots was distributed over the property. The sample plots were measured in 2010 and re-measured in 2014.
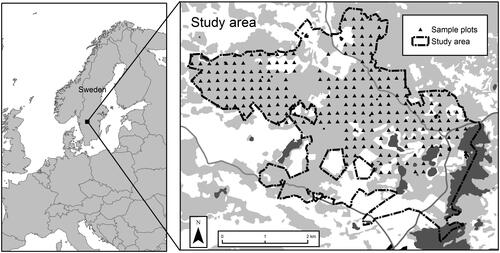
Table 1. Mean and standard deviation per species category for the sample plots used in the study, measured in 2010 and 2014.
Table 2. Remote sensing data was used in the study.
Table 3. An overview of the DA methods and prediction methods used in this study, and the cases evaluated when the prediction types and DA methods were combined.
Figure 2. rRMSE, using DA with EKF or EKFm, forecast from first time point (ALS), and ALS for the last time point, for calibrated and non-calibrated predictions. Growth periods are marked with dotted vertical lines.
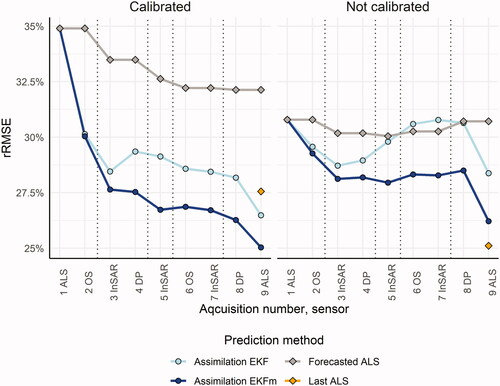
Figure 3. rBias using DA with EKF or EKFm, forecast from first time point (ALS), and ALS for the last time point, for calibrated and non-calibrated predictions. Growth periods are marked with dotted vertical lines.
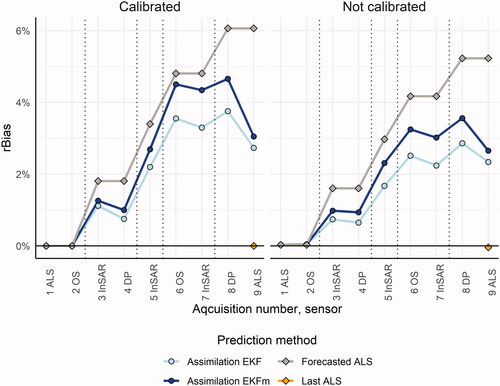
Table 4. Accuracy for single predictions of growing stock volume, individually assessed by empirical evaluation against the field references.
Figure 4. Boxplots of residuals for three categories of true volumes on the x-axis. Each group contains roughly the same number of observations.
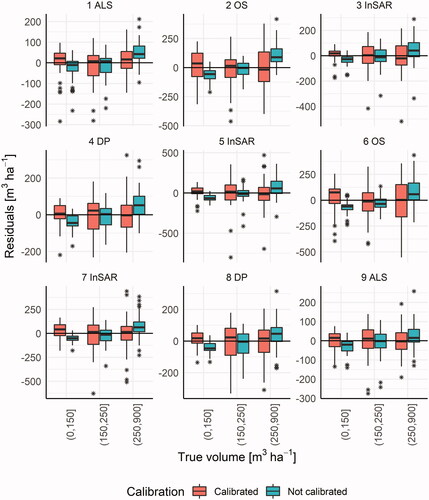
Figure 5. Correlation coefficients of residuals from predictions of growing stock volume using different sources of RS data. The left plot shows residuals after calibration while the right plot shows correlations of residuals for non-calibrated predictions.
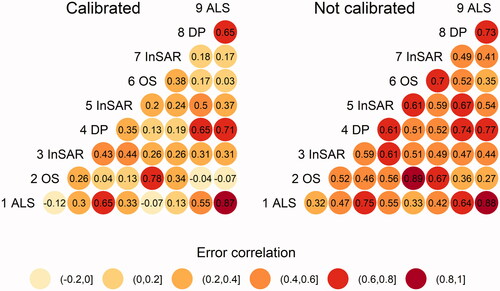
Figure 6. Comparison of empirically evaluated rRMSEs (EquationEquation 11[11]
[11] ) and model-based rRMSEs (EquationEquation 15
[15]
[15] ) from the filters. Growth periods are marked with dotted vertical lines.
![Figure 6. Comparison of empirically evaluated rRMSEs (EquationEquation 11[11] rRMSE=RMSEy¯ * 100[11] ) and model-based rRMSEs (EquationEquation 15[15] rSD=SDy¯ * 100[15] ) from the filters. Growth periods are marked with dotted vertical lines.](/cms/asset/3b761520-c1e3-4407-a122-4c2033f37b23/ujrs_a_1988542_f0006_c.jpg)
Table A.1. Details about the ALS data.
Table A.2. Details about the DP data.
Table A.3. Details about the TanDEM-X InSAR data.
Table A.4. Details about the OS data.
Estimated predictive modelsTable A.5. Coefficients and included variables for the estimated models predicting forest growing stock volume.