Figures & data
Figure 1. Schematic of Poincaré sphere (adapted from https://www.thorlabschina.cn/newgrouppage9.cfm?objectgroup_id=142)00).
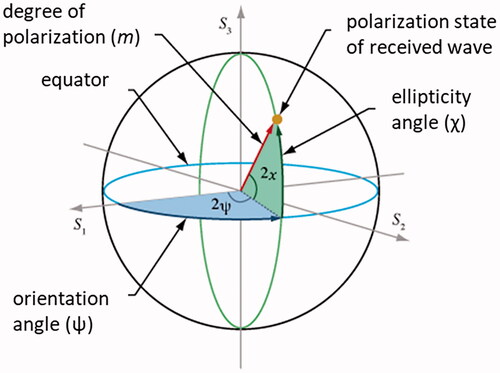
Figure 2. (a) Agriculture extent of Canada as mapped by AAFC since 2009, (b) location of Kenaston within the province of Saskatchewan and (c) RCM multi-temporal composite of the Kenaston study site.
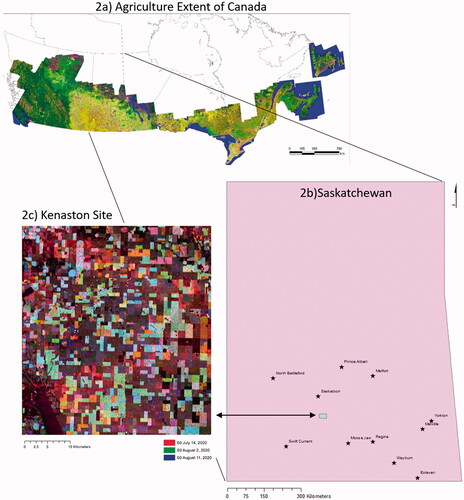
Table 1. BBCH phenology categories.
Table 2. Numbers of ground observations per crop type.
Table 3. RCM image acquisition dates. All dates were used for crop classification.
Table 4. List of parameters included in the classification runs.
Table 5. 2020 RCM data classifications in overall accuracy descending order.
Figure 3. Classified map of the Kenaston study site using a Random Forest classifier and inputs of the four Stokes and three m-chi parameters generated using RCM CP images. 17 30mCP images were used to create this figure.
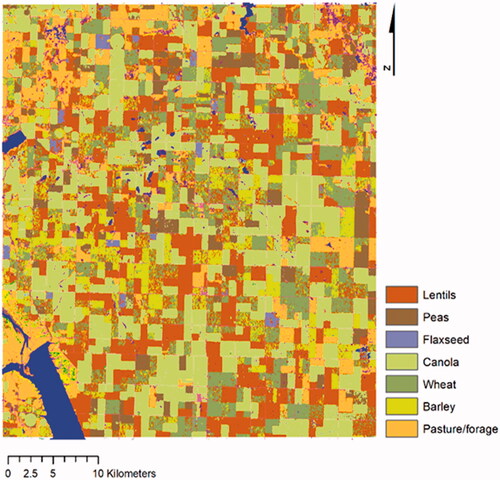
Table 6. Order of importance ranking from Random Forest classification.
Figure 4. Plots of Degree of Polarization (DoP) for each date of RCM (CP Beam B) acquisition, acquired for the entire growing season. DoP is calculated using the Stokes parameters. Key phenological stages of growth are indicated for each crop type.
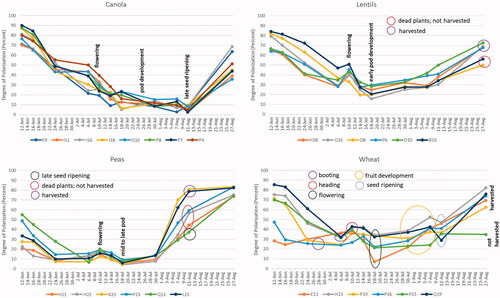
Figure 5. Mapping of development stages of canola (field P7) on projections of the Poincaré 3 D spheres. Projections include (a) Left Handed Circular (LHC); (b) 135o; and (c) Right Handed Circular (RHC). For the 135o projection, circular scattering is located at the poles, linear scattering at the equator and elliptical scattering in all other locations on the plot.
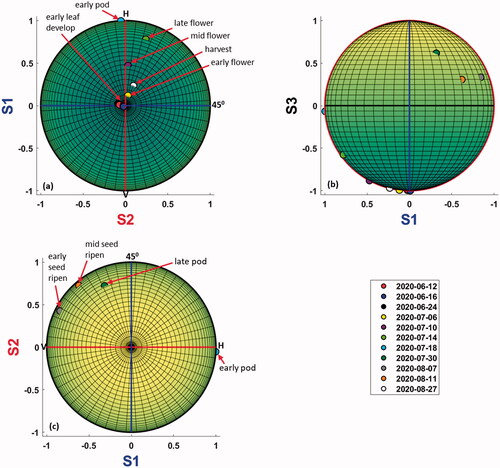
Figure 6. Mapping of crop development stages. Projections of the Poincaré sphere include Left Handed Circular (all crops) (left); 135o (lentils) or 00 (peas and wheat) (right).
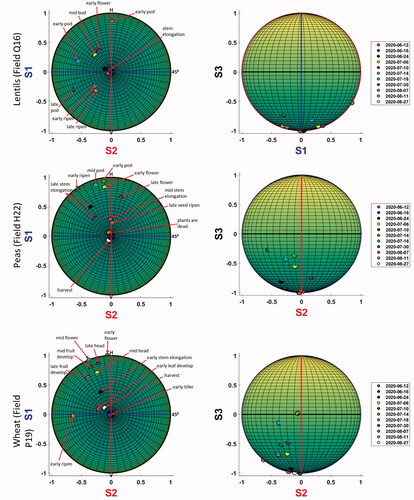
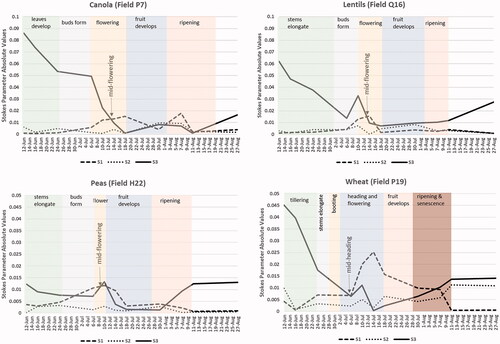
Figure 7. Plots of absolute values of Stokes parameters S1, S2 and S3. The point at which S3 declines to values close to S1 is indicated as is the phenology stage for this point.